
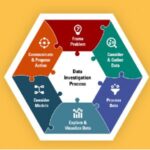
By Hollylynne S. Lee, Gemma F. Mojica, Emily Thrasher, NC State University, Friday Institute for Educational Innovation Many argue K–12 students need to urgently develop a practice of using data in investigations of real-world phenomena through processes that will prepare them to be data-literate citizens and open doors for data-intensive career pathways. Statistics and data … [Read more...] about Digging into Data: Illustrating a Data Investigation Process
Feature
Using 2020 Census Data in Your Classroom
By Jessica Palmer, US Census Bureau Did you know the population of the United States on April 1, 2020, was 331,449,281—an increase of 22,703,743—or 7.4 percent—from 2010? Or that California was the most populous state, with 39,538,223 residents, and Wyoming was the least populous, with 576,851 residents? Fun facts like these are great conversational facts to share with … [Read more...] about Using 2020 Census Data in Your Classroom
Revealing the Power of Data Visualizations in Social Studies Through Slow Reveal Graphs

By Kristen Taurence, Tamara Shreiner, and Bradford Dykes, Grand Valley State University Data visualizations cut across many disciplines and, as stated in the GAISE Pre-K–12 Report, more disciplines are incorporating statistical reasoning within their standards. In fact, data visualizations are ubiquitous in social studies education. Social studies textbooks and online … [Read more...] about Revealing the Power of Data Visualizations in Social Studies Through Slow Reveal Graphs
Thinking Like a Data Scientist: A Cross-Disciplinary Investigation on Climate Change
By Anna Gralnik, Aurelia Pennekamp Elementary School, and Anna Bargagliotti, Loyola Marymount University Climate change is one of the most important challenges of our generation. Across the world, extreme weather presents unprecedented structural and economic challenges for humans. Students should be given the space in educational settings to learn about the issues … [Read more...] about Thinking Like a Data Scientist: A Cross-Disciplinary Investigation on Climate Change
Developing the Theory of Hypothesis Testing: An Exploration
By Craig Lazarski, Cary Academy There are many concepts associated with hypothesis testing, but it all comes down to variation. How unusual is the variation we observe in a sample? Students can often lose sight of this basic idea once they have learned the various procedures introduced in an introductory statistics course. Further, they may blindly follow the procedure … [Read more...] about Developing the Theory of Hypothesis Testing: An Exploration
Skew The Script: A Website Offering Socially Relevant Math Lessons

By Dashiell Young-Saver “You can take those candies and shove them up your …” These were the last words Michael spoke to me before leaving class and leaving high school—permanently. We were using candy to simulate sampling methods. It was my first year teaching high-school statistics and I was proud of myself for creating an interactive activity, rather than a boring … [Read more...] about Skew The Script: A Website Offering Socially Relevant Math Lessons
A Sampling Activity to Anchor Big Statistical Ideas
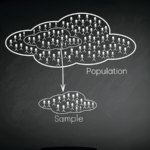
By Sandra Madden, University of Massachusetts - Amherst Have you ever gone looking for a highly productive and foolproof statistical reasoning task? In 2006, I designed a statistical sampling task for use in a professional development project. The intention was to showcase important statistical ideas, encourage conjecture and statistical argument, and illustrate the … [Read more...] about A Sampling Activity to Anchor Big Statistical Ideas
Data Interrogations for Critical Statistical Literacy

By Susan O. Cannon, Mercer University The classroom was unusually quiet, especially for a middle school. The only sound was that of pencils rushing across paper as students looked back and forth from the image projected on the screen to their papers. The image showed a refugee camp. Tents with the United Nations emblem stretched out in the background, and two women and three … [Read more...] about Data Interrogations for Critical Statistical Literacy
Focus on Statistics: Investigations for the Integration of Statistics into Grades 9–12 Mathematics Classrooms
Written by veteran teachers, this book includes 19 investigations to help you implement key statistical concepts in your classroom. Each investigation explicitly contains the four components of the problem-solving process presented in the American Statistical Association’s Guidelines for Assessment and Instruction in Statistics Education (GAISE) Report: A Pre-K–12 Curriculum … [Read more...] about Focus on Statistics: Investigations for the Integration of Statistics into Grades 9–12 Mathematics Classrooms
Teaching Statistics with Yummy Math

"When are we ever going to use this?" This is one of the most often asked questions in a K-12 math classroom. A helpful resource for applying statistics to everyday life is Yummy Math. Activities can be used as a single lesson filled with rich discussion or a quick class opener. Yummy Math consists of examples that allow students to both create and interpret mathematical models … [Read more...] about Teaching Statistics with Yummy Math