By Susan O. Cannon, Mercer University
The classroom was unusually quiet, especially for a middle school. The only sound was that of pencils rushing across paper as students looked back and forth from the image projected on the screen to their papers. The image showed a refugee camp. Tents with the United Nations emblem stretched out in the background, and two women and three children—faces downturned—walked toward the camera carrying plastic bags.
“What do you notice in the picture?” the teacher asked. “Let’s begin with a round.” The students read from their papers in turn.
“I see bunches of tents.”
“Some people have plastic bags.”
“I see the UN symbol.”
“There are blue things covering some of the tents.”
“The women have scarves on their heads.”
“People that might not have a home.”
The teacher probed, “What do you see in the picture that supports that?” A student responded, “They are carrying bags, and I think that the tents might be their home.” The teacher affirmed this response, “Ok, I can see how that inference could be supported by what you see in the picture. Remember you are making an inference from what you are seeing. In this round, we want to stick to what we can see.” The round continued with students stating one thing they noticed and the teacher interjecting with questions to highlight when students made inferences.
It might be surprising to find that this discourse took place in a mathematics classroom. Yet, the teacher highlighted distinctions that are crucial to the development of statistical literacy—the ability to read, write, and evaluate statistical arguments. These arguments are being presented with increasing frequency as more data is collected, gathered, and put forward for our consumption. Further, the curriculum presented here engaged the students in what Travis Weiland in a 2017 Educational Studies in Mathematics article termed critical statistical literacy, as students critically consider the ethics of how data is used to make decisions.
A person’s reading of the world is inevitably filtered by their social and political perspectives. This exercise attunes students to the biases they bring as they read the world. This is a crucial first step toward critical statistical literacy.
Critical Statistical Literacy
“How are they defining worst,” a student asked about a media report of a 2014 Ebola outbreak as the worst in history. The student’s question highlighted her attention to the different ways data is used to answer statistical questions. As data has become increasingly accessible and abundant, there is an urgency to provide students with opportunities to engage seriously with real-world data and consider how data is used in decision-making about public and private issues. Critical statistical literacy requires that students delve into the ways statistical arguments both influence the way we live in the world and potentially help us understand the reality in which we live.
Critical statistical literacy requires that when students read the Ebola outbreak was “the worst,” they consider how worst was defined and subsequently measured. What variables were used to define worst? What data was collected and how was it obtained? Do we measure worst in number of deaths? In number of families affected? Percentage of the population? Cost to the country? Number of children who died? Any of these statistics could have been used to argue it was the worst outbreak. Yet, to evaluate the reasonableness of the claim, they would need to know how worst was defined and what data was collected.
Statistics in the Curriculum
Robert Carver and colleagues’ Guidelines for Assessment and Instruction in Statistics Education: College Report reminds statistics teachers that statistics has become more salient as the amount and public availability of data have increased. However, Weiland would argue that the ability to do statistical calculations is not an adequate response to this increase. Students must also be equipped to consider how statistics and statistical thinking can be used to evaluate the structures in our society and work to destabilize unjust structures and creatively reimagine structures that are more just.
The Common Core standards focus on students using the investigative cycle, which requires students to formulate questions, collect data, analyze data, and interpret results. From my experience teaching middle school, however, students tend to investigate questions that are easily asked and answered: What are our favorite pets? How much TV does our class watch? What types of social media do students in our school use? They are far from addressing, much less intervening, in injustices in the world.
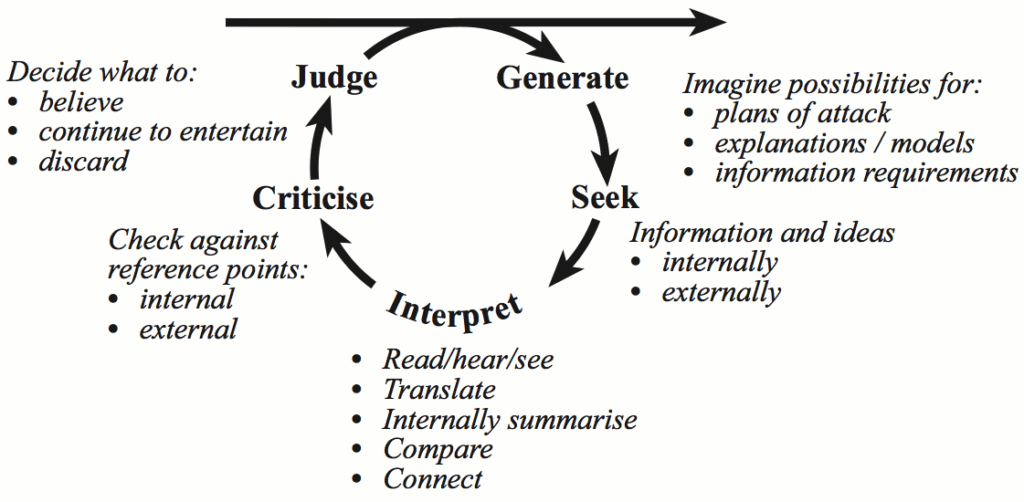
In this article, I argue for the importance of the interrogative cycle to build students’ understanding of the impact and influence of statistics on issues of ethical and moral importance (see Figure 1). By beginning with the interrogative cycle—a recursive cycle used in whole or in part throughout statistical problem solving—students see how statistics are used to shape our understanding of the world and learn to question the unethical use of data to inform their opinions.
Developing Critical Statistical Literacy in Middle Grades
Well-meaning teachers may have the desire to incorporate critical statistical literacy or social justice mathematics into their classrooms, and educational researchers such as Rico Gustein, Bob Peterson, and Laurie Rubel have developed high-quality predesigned lessons and units; however, these lessons might not be relatable to students, are outdated, or might actually draw out prejudices and biases. Alternatively, teachers can design lessons from scratch to incorporate mathematics and statistics with current events, yet this is prohibitively time consuming, especially given the pressures on mathematics teachers due to high-stakes testing.
The interrogative curriculum framework helps mitigate these tensions. This framework incorporates statistical thinking either on a weekly basis or through dedicated units in mathematics classrooms. Small groups of students can use it to explore topics of their choice, though it is recommended that students begin with a teacher-facilitated unit. Teachers can use this framework to develop critical statistical literacy as they explore issues that are timely and relevant to their communities.
The curriculum framework begins with an interrogative cycle that engages students in the context of the topic and builds curiosity prior to an investigative cycle. Two middle-school teachers developed and implemented these cycles, which they adapted from David Boud, Rosemary Keogh, and David Walker’s book, Reflection: Turning Experience into Learning. I observed these classrooms, took field notes, and collected student-created documents. I share the process and practices the teachers used to support imagination, curiosity, awareness, and engagement within the interrogative cycle.
The Interrogative Cycle for Critical Statistical Literacy
Topic Selection
Choosing a topic should take into consideration both the interests of the students and the availability of data related to the topic. In addition, the teachers in this study chose topics that would draw students’ attention to inequities regarding race and/or gender. As an example, the class considered the variable of race in publicly available data about police stops in Ferguson, Missouri, after the shooting of Michael Brown. They worked to understand how the overrepresentation of Black citizens in rates of arrests, tickets, and traffic stops constituted racial injustice. Statistical tools helped them begin to understand the outrage in the Ferguson community. The students built critical consciousness and became more aware of biases and assumptions in our society and the structures and systems that perpetuate these biases. In addition, the teachers carefully considered how topics would provide opportunities for connections to mathematics standards (see Table 1).
Table 1: Current Events and Mathematical Topics
Michael Brown and Protests in Ferguson, Missouri (rates and ratios), European Refugee Crisis (rates, graphing, %)
| 2014–2015 | 2015–2016 |
| Ebola (measures of center) | New Horizons Mission (scientific notation) |
| Gender Imbalance and Violence Toward Women in the Gaming Industry (probability) | TBI in the NFL (%, probability) |
| Marriage Equality Act (rates) | Sugar in Food (variability) |
| Rand Paul $1M/min (rates, estimation) | |
| Air Pollution in China (rates and effects of rounding) |
Gathering Materials to Build Curiosity and Awareness
In contrast to mathematical operations, statistical tools are designed to be used within a particular context. Prior to each unit, the teachers collected photographs, short articles, and videos that would build engagement and curiosity about the topic. In choosing media, they strove for a wide variety of images and short videos that would connect students emotionally to the people and places related to the topic. They wanted students to be able to imagine what it would be like to be in the shoes of the people involved and understand that the data they examined would not give them the full picture of a person or place.
Describe: Building Engagement and Curiosity
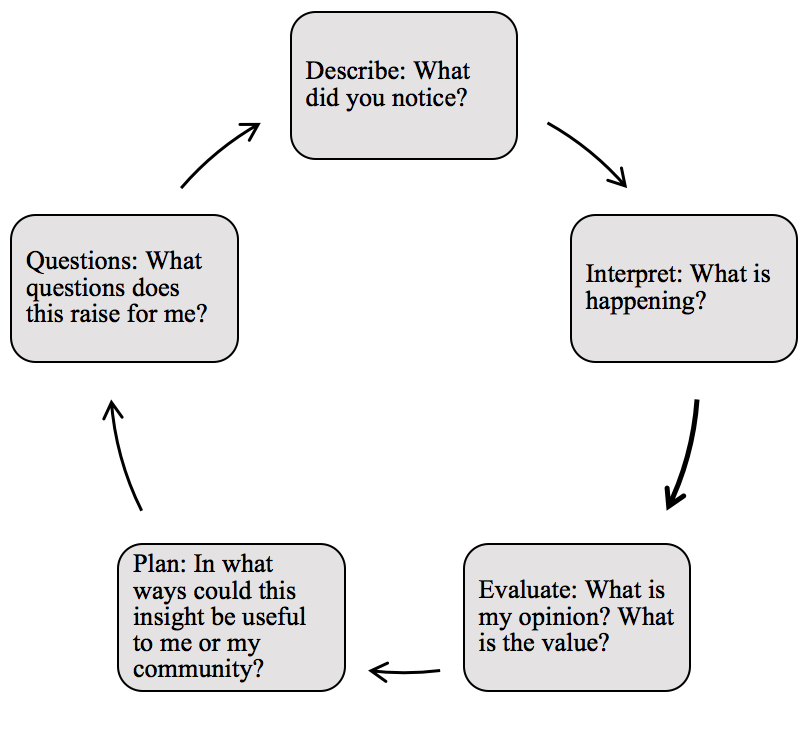
Once the teachers had the materials, they began the interrogative cycle (see Figure 2). They handed out laminated copies of photographs from the media and projected short videos about the topic. Students took notes on a graphic organizer. After sustained engagement with the media, the teachers conducted noticing rounds. In the rounds, students took turns sharing something they noticed in the media. The students could pass if they wished, but (importantly) each student was given dedicated space and time to share his/her/their ideas.
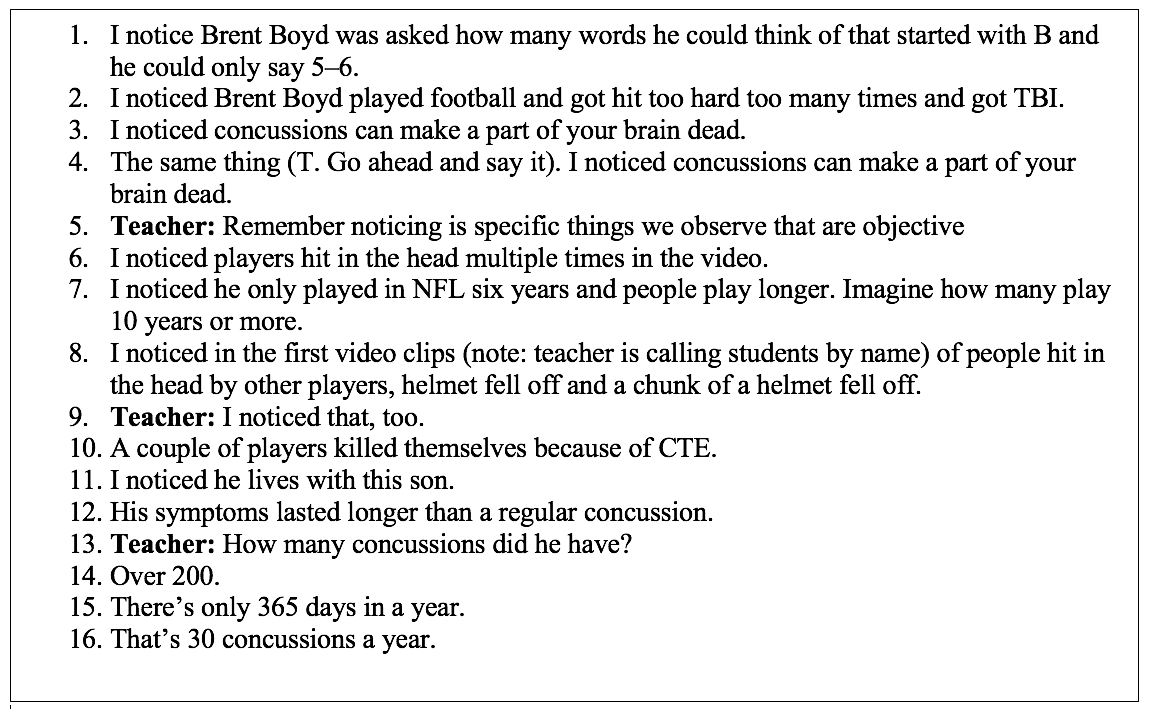
In line five of Figure 3, the teacher offers feedback to keep the students focused on what they could observe in the image. This monitoring of student responses helped students notice when they stated a fact that could be observed and pointed to in the image, video, or article and when they made an assumption or inference based on what they saw. Noticing their own biases is a crucial first step for middle-school students when developing statistical literacy. Careful attention and facilitation by the teacher during these rounds is necessary to point out and distinguish inferences from the evidence.
In addition to drawing attention to how often we make inferences from media and that those inferences are based in prejudice, the noticing rounds highlight how each student in the room notices different parts of the images. Variability in populations is a key statistical concept for students to grasp that can be accomplished through the exploration of textbook data sets. However, working with complex real-world topics can offer students a more meaningful understanding of variability. Further, if the students care deeply about the topics, they will begin to see the need for sophisticated statistical tools to consider questions of justice.
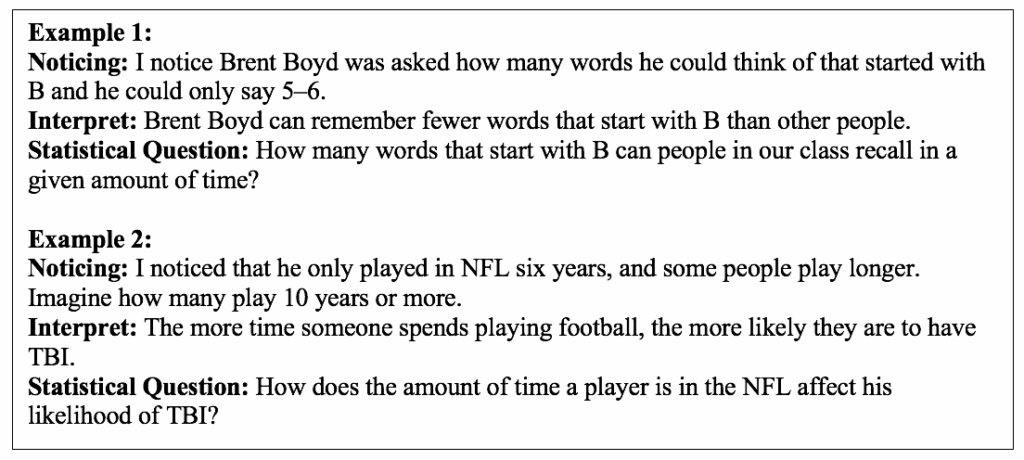
Interpret: Imagining Context
After the noticing rounds when the teachers asked students to resist interpretation in favor of careful noticing, the students began to interpret and imagine possible explanations. In this phase, students create explanations for what they saw, explore new insights, and make internal and external connections. In most classroom settings, students interpret prematurely without enough attention to context. Students (and adults) tend to rush to judgment, but the noticing rounds require them to take in multiple data points and perspectives as they draw conclusions. This stage is important in students’ recognition of the need for data. As they explore different interpretations, they may consider different data sources that could confirm or deny an interpretation.
Evaluate
Following the interpretation phase, the teachers asked the students to evaluate the topic to form judgments and consider how this connects to their lives and communities (see Figure 4).
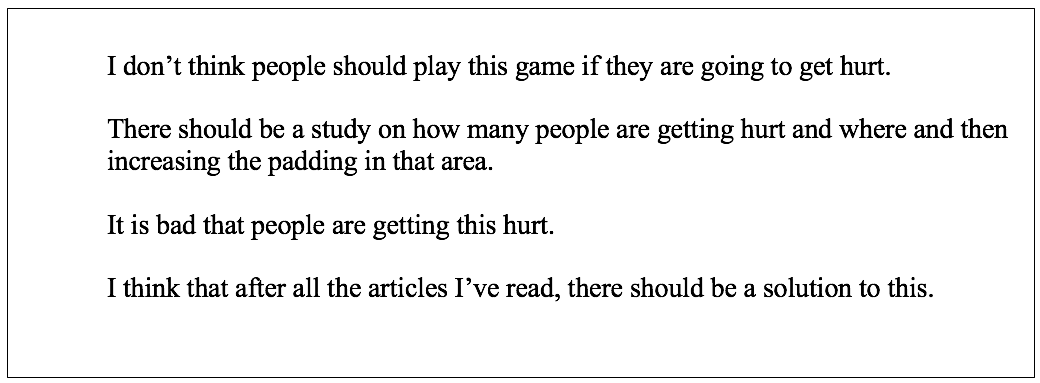
The evaluate phase prompts students to make initial judgements based on their interpretations. These statements then drive the need for data to support or deny the evaluations.
Plan
After evaluating, the students considered how their evaluations make sense given data sources and context. This is the point in which statisticians judge what information they need to keep, what they need to gather, and what they might discard or ignore. In the TBI unit, the students considered how they might evaluate a player’s risk of TBI. What variables should be considered, and which can be ignored? Do some matter more than others? What kinds of data would be needed to make a determination? These questions bring the students’ attention to the multiple and varied data sources and the choices made in determining risk for a particular position.
Question
The final phase in the opening segment of each unit required students to brainstorm questions related to the topic and data at hand thus far. The teachers prompted the students to list as many questions as they could about the topic.
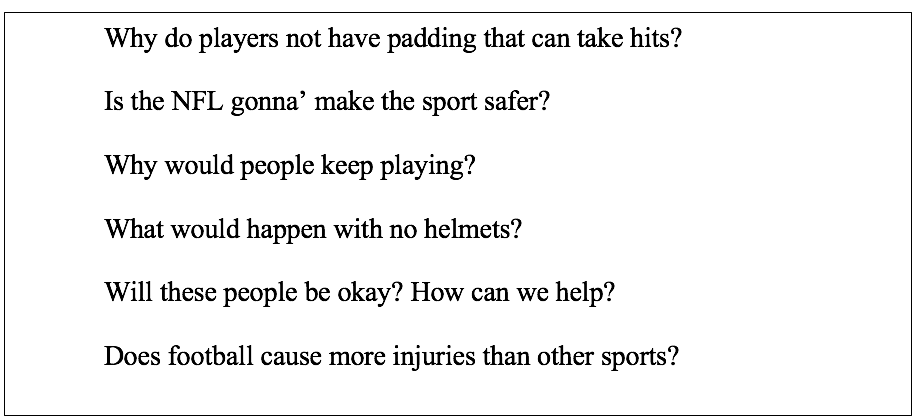
This part of the process functioned for the teachers as a way to gauge interest in various parts of the topic and consider what to explore in the investigative phase. It also provided students the opportunity to make sense of the topic and decide what mattered to them about it.
Criticize
After developing questions about a topic, the students move to consider data related to a class or individual question about the topic. In the TBI unit, students calculated the percentage of incidence of TBI by position (see Figure 6). In addition to the contextual knowledge built through the videos and readings, the teachers assigned groups so each group had at least one student who played football. The experiential knowledge these students brought was sometimes in conflict with the data in the table. One football player commented, “I play linebacker and I get hit way more than the kicker.” The students were then faced with the omnipresence of variability—that there is variation within all populations across variables and that statistics are representative of a snapshot of the population. They are not true of every player or person in the population.
By using complex data from real-world contexts, students were confronted with the omnipresence of variability in data. When asked what the incidence rate tells about a player position, a student responded, “Some positions are more dangerous than other positions.” This statement brought questions from other students: “What about total time on the field?” “Do different teams have fewer or more incidences of TBI?” “Does the time of day of the game matter?” “How does race matter?” The students wondered about the relationship between variables and questioned possible associations—they were primed for the investigative process.
Moving from Interrogative to Investigative
Once the students work through the interrogative cycle, engaging deeply in the available data and other resources on the topic, they can delve into an investigative cycle. As shown in Figure 7, students generate statistical questions as they participate in the interrogative cycle. The students can investigate one of these questions by designing a data-collection procedure or working with publicly available data sets. Importantly, due to their engagement in the interrogative cycle, they will have a strong understanding of the context and be able to evaluate the practicality and reasonableness of their conclusions.
Opportunities and Cautions
The interrogation of statistics in current events and the use of publicly available data sets provide ample opportunity for engagement with rich mathematics and statistics. In this article, I have referenced those opportunities, and my focus has been on the accompanying thinking skills and dispositions not often explicitly taught in mathematics classrooms. Critical statistical literacy develops over years of sustained engagement with complex data. The framework provided here can offer opportunities to build statistical thinking and dispositions related to issues that are socially relevant and of interest to students. It also builds relevance and practicality for mathematical and statistical tools to address issues of justice, and middle-school students typically have a keen sense of justice.
Incorporating these activities not only provides opportunity to develop statistical thinking in middle-grades classrooms, it also provides an important and exciting opportunity to shift the culture of mathematics classrooms from places where there are one or two right answers or solution pathways to places of shared knowledge and perspective.
There are many opportunities to connect and engage with mathematics curriculum and standards, but I hope teachers and their students will value the uncovering of biases, potential to question racist structures, and broadening of perspective developed through the interrogative process. Mathematics classrooms should be places where students can be curious, dig deeply into topics, and ask difficult questions. However, students will need teachers who are willing to dedicate time and emotional energy to this type of work and who are prepared to have difficult conversations with students.
A Picture’s Worth
To normalize conversations about race, gender, and equity in mathematics classrooms, students need opportunities to engage deeply with contexts and expand their awareness of their own biases. These types of engagements draw on different dispositions than those typically rewarded in mathematics classrooms and are supported by different classroom practices.
Though the noticing rounds proposed here may seem like a small detail to the overall interrogative cycle, they are a promising practice for mathematics teachers. They promote equity of voice and the suspension of judgement.
The noticing round is beautiful in its simplicity and can be used at different parts of the framework. The rules are that students each have a turn to speak in order around a circle or another pattern in the classroom. Any student can pass simply by saying “pass.” Repeating responses is allowed and even encouraged. Rounds can continue until there are no new ideas or as time allows.
Noticing rounds and the interrogative cycle provide different ways of being successful in mathematics classrooms and open a space for students who do not see themselves as mathematicians or understand the relevancy of mathematics in their lives. Students enrolled in the course said the interrogative cycle gave them a way to connect other subjects to math and know there are things bigger than themselves. They also said it made them better in math.
Just like a photograph on the front page of a newspaper, a statistic gives readers a split-second impression about an event or topic. As with the photograph, when students and teachers interrogate the statistics and consider how they are constructed, they can see the inherent biases of statistics. This does not mean statistics are not valuable or cannot be trusted, but rather that students need to have opportunities to consider how they are produced and not take them at face value.
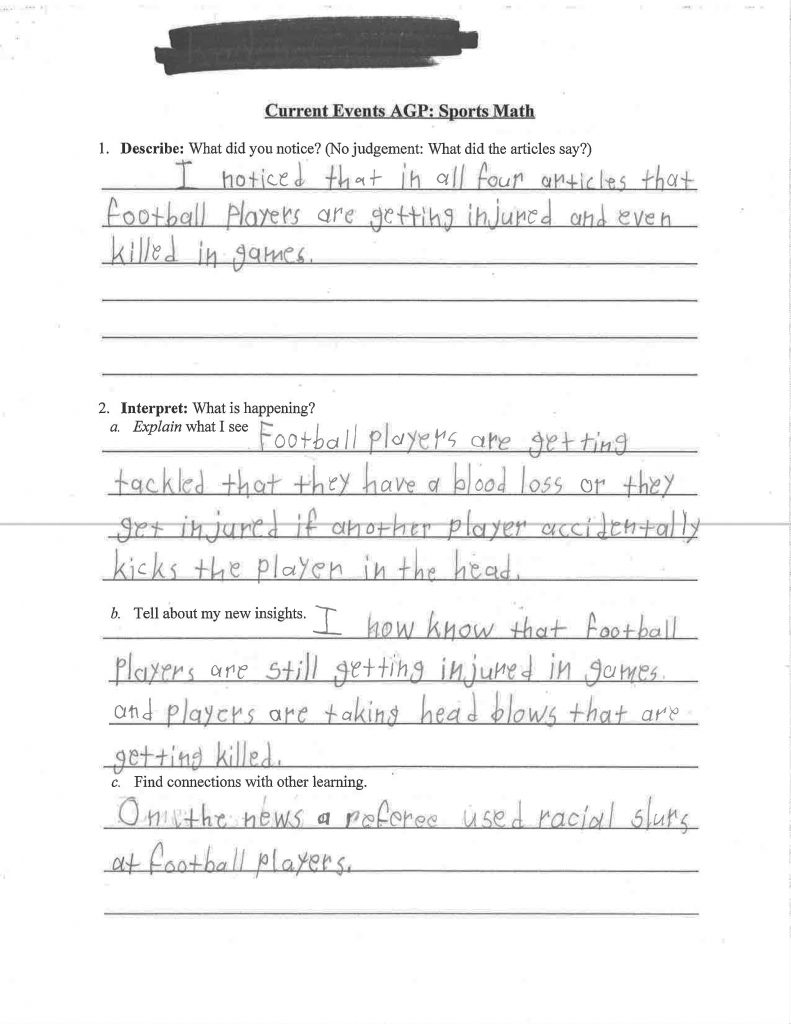
TBI in NFL Student Work Sample