

By Emily Thrasher, Hollylynne Lee, Bruce Graham, Matthew Grossman, Gemma Mojica, NC State University This paper explores a comprehensive framework to develop students’ data literacy by guiding them in making sense of complex data visualizations. With the growing complexity and prevalence of data visualizations in media, it’s crucial to equip students with the skills to … [Read more...] about Making Sense of Data Visualizations: A Toolkit for Supporting Student Discussions
Data collection
Lesson Plan: Screen Time and Notifications

By Holly Davis, Kennesaw State University Overview of Lesson Is screen time beneficial or harmful? In this lesson, students will learn how to collect data on the hours they spend on their smartphones and represent it visually. They will also explore a correlation analysis between the two quantitative variables of hours of screen time and number of notifications. This is … [Read more...] about Lesson Plan: Screen Time and Notifications
Data Science in Secondary Grades: Exploring Our Communities Through Pictures

By Michelle Dueck, Heritage Christian School; Pedro Gallegos, APEX Academy Charter School; Rosa Pastor, LA Promise Charter Middle School; Alvaro Pineda, East Valley High School; and Anna Bargagliotti, Loyola Marymount University Today, data is more critical than ever. Often, data are collected automatically through devices throughout our daily lives. A big challenge in … [Read more...] about Data Science in Secondary Grades: Exploring Our Communities Through Pictures
A Guided Lesson on Fake News for Improving Statistical Literacy

By Rebecca Pierce, Ball State University, and Matthew Brenneman, Embry Riddle Aeronautical University The goal of the GAISE: Pre-K–12 Report is statistical literacy for all. But statistical literacy is not achievable unless students understand why they personally need to learn statistics. One could cite high-paying jobs in data science as a motivation, but this pertains to … [Read more...] about A Guided Lesson on Fake News for Improving Statistical Literacy
Lesson Plan: Bayesian Inference for Proportion of Water on Earth

By Jason Cleveland, Jacksonville State University Overview of Lesson In this lesson, students will practice data collection through simulation, performing estimation, and providing support for or against a claim. The focus will be on what proportion of Earth is covered by water. To accomplish this, students will employ a simple technique for binary data and use web apps … [Read more...] about Lesson Plan: Bayesian Inference for Proportion of Water on Earth
Thinking Like a Data Scientist: A Cross-Disciplinary Investigation on Climate Change
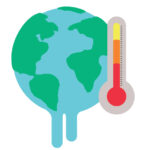
By Anna Gralnik, Aurelia Pennekamp Elementary School, and Anna Bargagliotti, Loyola Marymount University Climate change is one of the most important challenges of our generation. Across the world, extreme weather presents unprecedented structural and economic challenges for humans. Students should be given the space in educational settings to learn about the issues … [Read more...] about Thinking Like a Data Scientist: A Cross-Disciplinary Investigation on Climate Change
Lesson Plan: Using Photographs as Data Sources to Tell Stories About Our Favorite Outdoor Spaces

Pip Arnold, Sheri Johnson, and Leticia Perez all started with the same initial prompt: Use photographs as data. The result? Three lesson plans that show it is possible to take an idea and develop it to best suit the interests of your students and you. All three lessons are aimed at the grades 6–9. You may like to work with one lesson plan or pick elements of all three to use … [Read more...] about Lesson Plan: Using Photographs as Data Sources to Tell Stories About Our Favorite Outdoor Spaces
Data Interrogations for Critical Statistical Literacy

By Susan O. Cannon, Mercer University The classroom was unusually quiet, especially for a middle school. The only sound was that of pencils rushing across paper as students looked back and forth from the image projected on the screen to their papers. The image showed a refugee camp. Tents with the United Nations emblem stretched out in the background, and two women and three … [Read more...] about Data Interrogations for Critical Statistical Literacy
Lesson Plan: How Long Are the Words in the Gettysburg Address?

In this lesson by Gary Kader, Christine Franklin, Tim Jacobbe, and Kaycie Maddox, each student tries two methods for selecting a sample from the population of words in the Gettysburg Address: self-selection and simple random sampling. Then, as a class, students construct dotplots and calculate numerical summaries to show how sample means vary from sample to sample. Using … [Read more...] about Lesson Plan: How Long Are the Words in the Gettysburg Address?
Lesson Plan: How Fast Are You?

By Maryann Huey, Alana Linde, Dan Aalbers (Grades 6-8, 9-12+) In this lesson, published in August 2017, each student collects 20 reaction-time data values using an online tool for testing reaction times to a visual stimulus. Students display and analyze data via a free online tool, Tuva. Students first characterize their own reaction times, and then compare the results … [Read more...] about Lesson Plan: How Fast Are You?