

By Michelle Dueck, Heritage Christian School; Pedro Gallegos, APEX Academy Charter School; Rosa Pastor, LA Promise Charter Middle School; Alvaro Pineda, East Valley High School; and Anna Bargagliotti, Loyola Marymount University
Today, data is more critical than ever. Often, data are collected automatically through devices throughout our daily lives. A big challenge in education is preparing students to deal with the different types of data that have emerged. While data might be considered a collection of numbers and facts organized into spreadsheets, it is so much more. Pictures, sounds, and text are all considered data.
How can these types of data be incorporated into the school curriculum to better prepare students for today’s societal needs? The Guidelines for Assessment and Instruction in Statistics Education II report includes several recommendations for including data science principles in the school curriculum. In addition, several new state standards and frameworks are beginning to include data science (e.g., Chapter 5 in the CA Framework).
Here, the authors introduce a data science investigation carried out in their middle school and high school classes that uses pictures as data. Students were instructed to take pictures of their environments to answer several investigative questions. Features of their environments were recorded and transferred to a spreadsheet, and students used that information to analyze and find patterns across the pictures.
Investigative Questions & Data Collection
Due to the different student audiences, the authors slightly adjusted the statistical investigative questions posed. Alvaro Pineda, a high school teacher at East Valley High School, posed the following to his geometry class:
What are typical features of the streets of your community?
Pineda instructed his students to take and submit within a week a picture of a street they typically pass. The pictures included areas of the east San Fernando Valley. A total of 32 students submitted one photo each.
Rosa Pastor, a middle school teacher at LA Promise Charter Middle School, and Pedro Gallegos, a high school teacher at APEX Academy Charter School, posed the following to their 8th grade class and AP Calculus class, respectively:
What are the typical features of the environment outside our windows?
Pastor and Gallegos instructed students on a random Monday and Thursday to take a picture outside their windows between 2:00 p.m. and 2:10 p.m. The images showed the outdoor views of students living in the urban areas of Hollywood and Vermont Square/South LA. Between the two classes, students submitted 28 photos.
Michelle Dueck, a high school teacher at Heritage Christian School, posed the following to her honors pre-calculus class:
What are the typical features of where you go to be active outside?
Dueck instructed her students to get away from their screens and be active outside over a particular weekend, taking a picture of their surroundings whenever possible. Students received bonus participation points for each picture (up to a max of four) they submitted before the next class period. A total of 63 pictures were submitted that predominantly included shots of the suburbs surrounding Los Angeles.
Students participating in the investigations were from different grade levels, abilities, and content knowledge, so there were differences in the instructions given. However, all the pictures were collected, processed, and analyzed similarly.
In each case above, teachers provided specific instructions for submitting the pictures. The teachers organized the students’ submissions into Google folders and renamed the pictures numerically for consistency.
Guided by their teachers, students examined the pictures and brainstormed typical features they saw. After a group discussion and using the students’ brainstorming ideas, the teachers identified and defined several categorical and quantitative variables to record.
Table 1 illustrates the data collection questions the teachers used to generate and determine the quantitative and categorical variables from the pictures. The questions in Table 1 are those the teachers posed to the students to collect data about different attributes of each picture. An example of the names of the corresponding variables is pictured in Table 2 below.
Table 1
| Pineda Questions | Gallegos & Pastor Questions | Dueck Questions |
|---|---|---|
| How many streets are in the picture? | What percentage of the photo showed man-made features? | How many people are visible? |
| How many cars are in the picture? | What percentage of the photo shows nature? | Is water present? |
| How many traffic lights are in the picture? | How many vehicles are in the picture? | Is there a dog visible? |
| What is the condition of the road? | Was the picture taken on the 1st floor or 2nd floor? | What is the apparent location (residential, town, nature)? |
| Were the pictures taken during the day or night? | Was the picture taken on a main street or residential? | Is there sporting equipment present? |
| Do you recognize the street? | Is your neighbor next to you or not? | What percentage of the photo showed man-made features? |
| Is the street a main street? | What type of enclosure surrounds the home (wall, fence, nothing)? | What percentage of the photo shows nature? |
| What is the shape of the roads? | ||
| Is your community safe? |
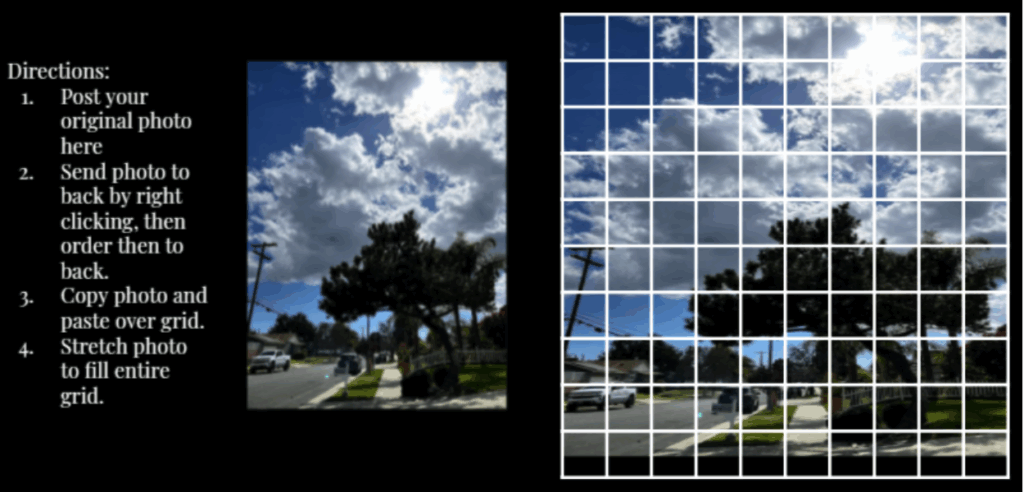
To ensure accuracy of the quantitative variables involving percentages (i.e., percentage man-made and percentage nature), pictures were resized to fit a uniform 10 by 10 grid for calculations. For example, one of Gallegos’ students submitted a photo of the outdoors they see outside their window (see Figure 1). A 10 by 10 grid was then placed on the picture to provide a method for computing the necessary percentages. The number of squares, including nature and those that have man-made features, could be counted and divided by 100 (100 total squares) to compute a percentage. In the photo in Figure 1, 56 squares on the grid predominantly have man-made features and 33 predominantly have nature. Therefore, the student recorded this picture as having 56% man-made (see Question 1 in Table 1) and 33% nature (see Question 2 in Table 1).
Figure 1
In another example taken from Dueck’s class, Figure 2 shows the directions Dueck gave to create the grid.
Figure 2
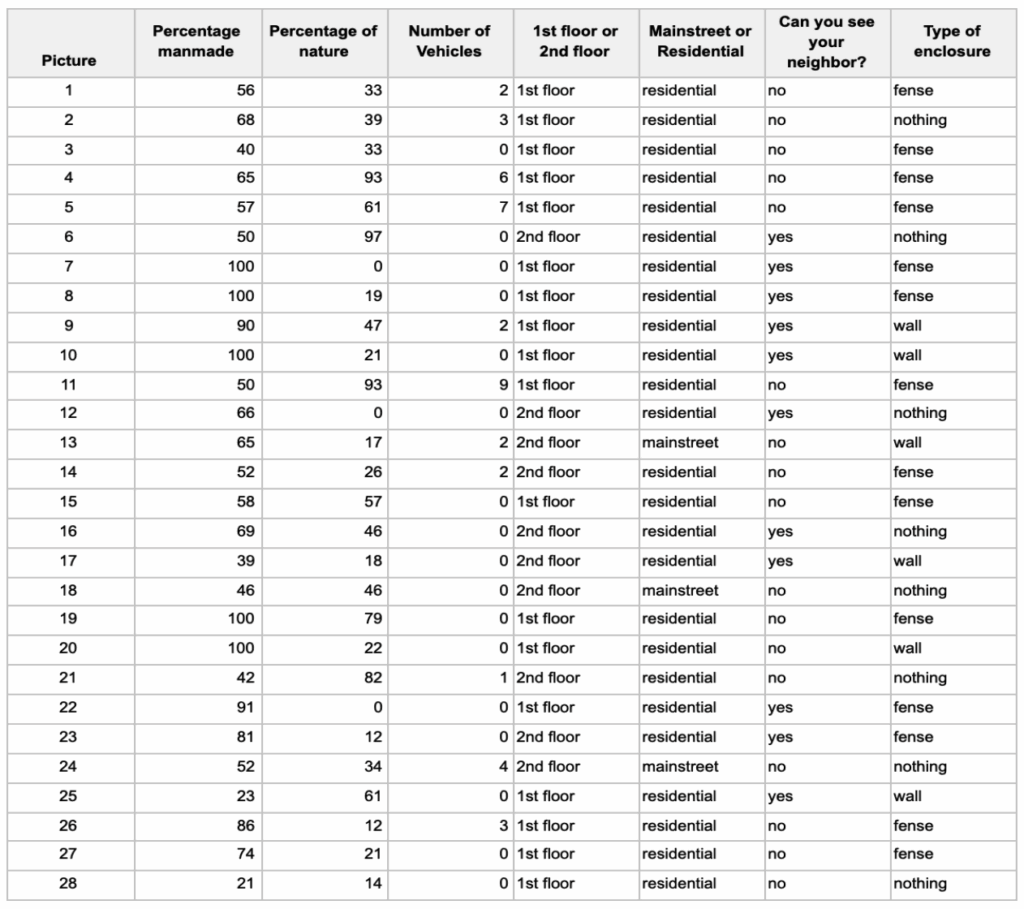
Using the questions in Table 1, Pineda created a data set with five quantitative variables and five categorical variables, Dueck created a data set with three quantitative and four categorical variables, and Pastor and Gallegos created a data set with three quantitative and four categorical variables (see Table 2).
Table 2
Analysis of the Data Collected
As a first step in the analysis process, the teachers created worksheets (PDF download) tailored to their students to help scaffold their data analyses. The worksheets began with a video that showed students data is all around them and introduced the basic ideas of data science.
Next, teachers reviewed key terminology, types of graphs, information provided in graphical displays, measures of center, and measures of variability. Each worksheet then guided students through a series of analysis questions discussing one or two variables in the data set to guide students into investigating features within their pictures. For example, Pineda’s worksheet asked the following 14 analysis questions:
- If you were to choose a picture at random, what would be the most likely number of streets? Justify your answer using data.
- What is the mean, median, and range of the number of cars?
- What is the mean, median, and range of the number of traffic lights?
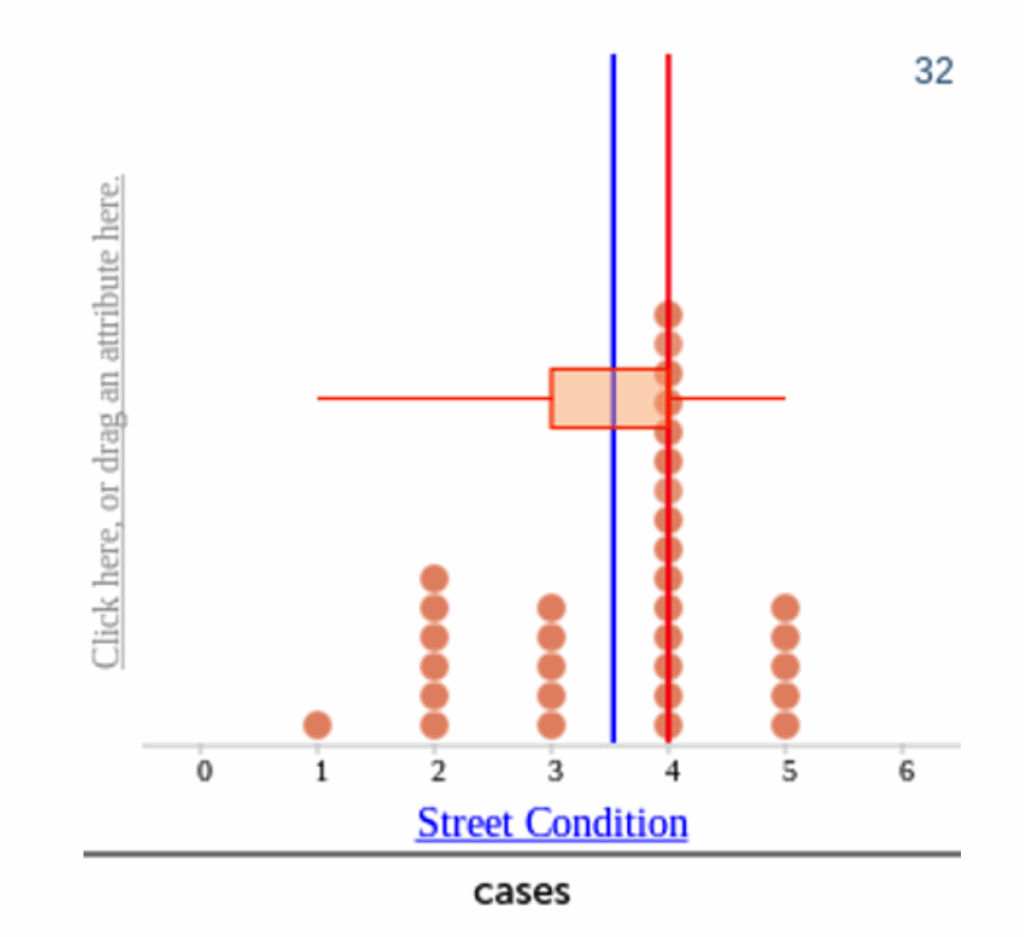
- How many of the streets had a condition rating of 4 and 5?
- How many of the streets had a condition rating of 1 and 2?
- Compare the condition of the streets and determine if most of the streets in your neighborhood are in good or bad condition.
- Predict if the data will demonstrate that our community has a large number of trees or not.
- Find the mean and median of the number of trees in the pictures. Do you think your community needs more trees?
- Were most pictures taken during the day or night? Use percentages to justify your answer.
- How familiar are you with the pictures from your community? Use percentages to justify your answer.
- Do people tend to be near main streets or in residential areas? What percentage of pictures involved main streets?
- The type of street categorized the streets. Some were single straight roads and others were intersections. What are the common types of roads in your community? Use percentages to support your answer.
- Based on the safety data, would you say your community is safe?
- Regarding safety, is there an association between the time of day the picture was taken? Compare the time of day and safety to justify your answer.
Students used the Common Online Data Analysis Platform, CODAP, to conduct their analyses. This open-source software allowed students to visualize plots and statistics of categorical and quantitative variables within their data sets quickly. To help students use the software, Pineda created an instructional video for the class.
Using the graphical displays made in CODAP, students answered each analysis question on the worksheets. For example, a student in Pineda’s class answered Question 6 as follows:
“I think most streets had more ratings of good condition than bad condition. 15 streets were rated a 4, 5 streets were rated a 5, 1 street was rated a 1, and 6 streets were rated a 2. There were a lot of streets with good ratings but there was also a little streets with lower ratings.”
Interpretation of the Results
After answering the analysis questions, students applied all they learned from their analysis to crafting a response to their original investigative question. Table 3 illustrates several student answers.
| Table 3 |
|---|
| Based on the previous data, the typical features consist of nature settings and an average of 2.8/3 people featured in each picture. Typical features don’t include water, as only 24% of all pictures feature water, and dogs, as just 11% of all the pictures feature a dog. Also, typical features do not include sporting equipment, as only 14% of all the pictures included sporting equipment, making it unlikely to feature from a general standpoint. Atypical/rare features include both water and dogs featured in a picture, with just a single picture having both. |
| Based on the information, I would describe the pictures of the community safe. I think the community is safe to be around 75% of people feel safe in this community. The range of cars is 31 so there are a few cars, so it might be crowded and a lot of traffic. The range of number street lights was 15 which is a lot of lights, safe enough for safe crossing. 15 streets had a rating condition of 4 which I think is pretty high in the condition category. 84% of people were familiar with the location of the pictures taken at, so the streets are safe because most people know the streets. 66% of pictures were taken during the day, maybe some people feel comfortable at night or maybe they wanted a better look at the pictures. |
| You’d most likely run into 2 streets rather than one single one. There aren’t too many traffic lights but there is a decent amount of cars. The streets are in good condition with a fair amount of trees around. You’re also likely to be in an intersection of a main street rather than residential. The people in the community feel safe in the area as well. |
| The typical percentage of features of the environment we see outside our windows was surprising for me. The percentage of manmade features was way lower and higher than mines, I guessed it would be around 45%-56% but it was 21%-100%. For the natural features, I thought it would be around 55%-65% but it was 0%-97%. For vehicles, I thought the percentage would be 34%-45% but it was way lower than mines from 0% to 9%. I think the results support the question and the investigations we are doing because it shows that if you live somewhere, it would be different for other people. I think some areas we can further study taking pictures on different hours until 5 in the afternoon. I believe this because these pictures were taken from 2pm to 2:10pm. No recommendations at the moment. |
Students could incorporate information from several analysis questions to form complete, well-rounded answers. The teachers noted students needed to be encouraged to think about all the variables in the data set and analyses to form answers.
Reflections & Recommendations
The lesson engaged students with picture data in an active learning, project-based statistical investigation. The investigation took several days and, in some cases, weeks. Gallegos thought the lesson positively affected his class by providing real-world data and creating awareness of their neighborhood. For example, when reflecting on the project and making sense of the findings, one student in Gallegos’s class asked, “Are low-income neighborhoods experiencing a disadvantage of access to nature? Are low-income neighborhoods becoming more gentrified?” These questions reflect the in-depth thinking the student generated by analyzing the data collected.
Pineda’s students actively participated in the data-collecting process and understood there are different representations of data. In this case, pictures of the area around them were data from which students could learn about their community. For example, one student reflected on the positive observation of having many trees in the community. The student stated, “There are many trees but I think it’s good to have trees because of the environment; animals or insects in need to have a home in the city and get to interact with them.”
Pastor thought the lesson allowed her students to focus on analyzing the information, rather than having to generate the graphs with no purpose. Furthermore, students could have conversations about numbers and make connections due to understanding where the numbers came from. Students were excited to engage in this data analysis after hearing it is a growing field and they were getting first-hand experience.
Dueck found the investigation opened students’ eyes to being surrounded by and constantly generating data. This lesson allowed students to engage with raw data from pictures. From gathering to processing to analyzing, students learned investigative techniques and analysis tools available to both see and work with pictures as data to make discoveries about themselves and the world around them.
Providing students with more tutorial videos for CODAP that demonstrate how to perform the basic tasks necessary for this project would improve the lesson. Having videos for students to watch and reference later proved extremely valuable once implemented by Pineda and Pastor.
Students could also benefit from getting both sentence starters to answer the analysis questions and a graphic organizer to help them gather their thoughts to provide more detailed answers for the final summary. Providing these tools helps students make connections between the picture data and their interpretations.
Additionally, giving the students a detailed grading rubric for their conclusions regarding the investigative question would provide more precise direction in what they should include by detailing the key elements that should be present.
Finally, questions that focused on two-variable analysis presented a much greater challenge for all the students, thus indicating more scaffolding and practice is necessary for students to work with multiple variables simultaneously.