

By Venessa N. Singhroy and Rommel Robertson, Queensborough Community College Overview of Lesson Students will learn about the concept of randomness and see how human decision-making contrasts with computer-generated choices. They will also explore the law of large numbers through graphs and be exposed to the Chi Square Goodness-of-Fit test. This lesson also incorporates … [Read more...] about Lesson Plan: Human vs. Machine: Unveiling Randomness with Data Visualization and Stats
lesson plan
Lesson Plan: Screen Time and Notifications

By Holly Davis, Kennesaw State University Overview of Lesson Is screen time beneficial or harmful? In this lesson, students will learn how to collect data on the hours they spend on their smartphones and represent it visually. They will also explore a correlation analysis between the two quantitative variables of hours of screen time and number of notifications. This is … [Read more...] about Lesson Plan: Screen Time and Notifications
Editors’ Note: Spring 2023
This issue of Statistics Teacher features two articles and three lesson plans with plenty of details for teachers to incorporate into their own practice. In “If You Only Have One Hour … Teaching Statistical Inference to Youth,” Beth Chance, Elsa Medina, and Jacquelyn Silverbush share a series of activities used with students in grades 4–6 to introduce statistical inference. … [Read more...] about Editors’ Note: Spring 2023
Lesson Plan: Exploring the Sampling Distribution of the Sample Proportion with a Study of Fingerprint Types in the US
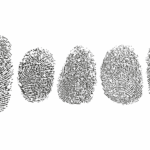
By Megan Mocko, University of Florida, and Katina Gothard, Eastern Florida State College Overview of Lesson In this activity, we will explore the population distribution and sample distribution of fingerprints with loops. Students will also explore how the sample proportion of fingerprints with loops varies from sample to sample. After collecting many sample proportions, … [Read more...] about Lesson Plan: Exploring the Sampling Distribution of the Sample Proportion with a Study of Fingerprint Types in the US
Lesson Plan: Using Photographs as Data Sources to Tell Stories About Our Favorite Outdoor Spaces

Pip Arnold, Sheri Johnson, and Leticia Perez all started with the same initial prompt: Use photographs as data. The result? Three lesson plans that show it is possible to take an idea and develop it to best suit the interests of your students and you. All three lessons are aimed at the grades 6–9. You may like to work with one lesson plan or pick elements of all three to use … [Read more...] about Lesson Plan: Using Photographs as Data Sources to Tell Stories About Our Favorite Outdoor Spaces
Lesson Plan: How Long Are the Words in the Gettysburg Address?

In this lesson by Gary Kader, Christine Franklin, Tim Jacobbe, and Kaycie Maddox, each student tries two methods for selecting a sample from the population of words in the Gettysburg Address: self-selection and simple random sampling. Then, as a class, students construct dotplots and calculate numerical summaries to show how sample means vary from sample to sample. Using … [Read more...] about Lesson Plan: How Long Are the Words in the Gettysburg Address?
Lesson Plan: The Mean and Variability from the Mean
The Pre-K-12 GAISE report emphasizes that students should be able to do more than just calculate summary statistics; they need conceptual understanding of those statistics that deepens as they progress through different levels of statistical literacy (Levels A, B, and C). The purpose of this activity is to develop students’ conceptual understanding of numerical summaries used … [Read more...] about Lesson Plan: The Mean and Variability from the Mean
Lesson Plan: A Tale of One City and Two Lead Measurements

By Kirk Anderson and Mary Richardson, Grand Valley State University Overview of Lesson In 2014, a crisis began when the city of Flint Michigan switched its water supply in an effort to save money and the water became contaminated with lead. The EPA’s Lead and Copper Rule states that if lead concentrations exceed an action level of 15 parts per billion (ppb) in more than … [Read more...] about Lesson Plan: A Tale of One City and Two Lead Measurements
Lesson Plan: Choosing a Study Design for the Polio Vaccine

By Adam Molnar, Oklahoma State University Overview of Lesson This activity, based on real meetings during the 1954 Salk polio vaccine study, asks students to decide on an experimental design to test the polio vaccine. Students take one of multiple roles—such as statistician, parent, and government—that may lead to different design choices. Real-world study design involves … [Read more...] about Lesson Plan: Choosing a Study Design for the Polio Vaccine