
By Megan Mocko, University of Florida, and Katina Gothard, Eastern Florida State College
Overview of Lesson
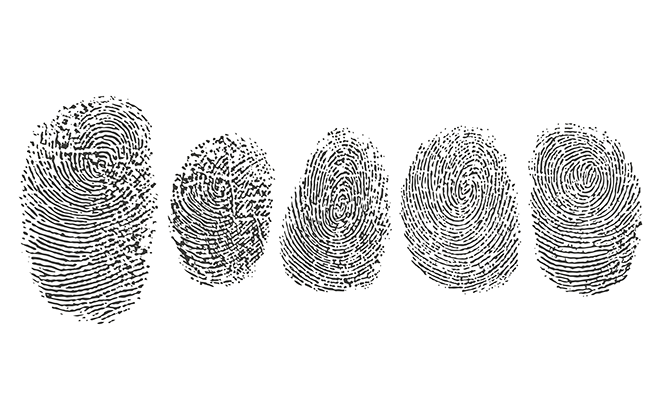
In this activity, we will explore the population distribution and sample distribution of fingerprints with loops. Students will also explore how the sample proportion of fingerprints with loops varies from sample to sample. After collecting many sample proportions, they will explore the distribution of many sample proportions.
This activity is meant to be an introduction to the definitions of and contrast the differences between population distributions, sample distributions, sampling distributions, and standard error. Students will draw simple random samples; calculate sample proportions; construct histograms; and compare sampling distributions’ shape, mean, and variability. By the end of the activity, students will be able to distinguish between these terms and estimate the standard error for a sampling distribution.
Download: PDF Lesson Plan
Download: Word Lesson Plan
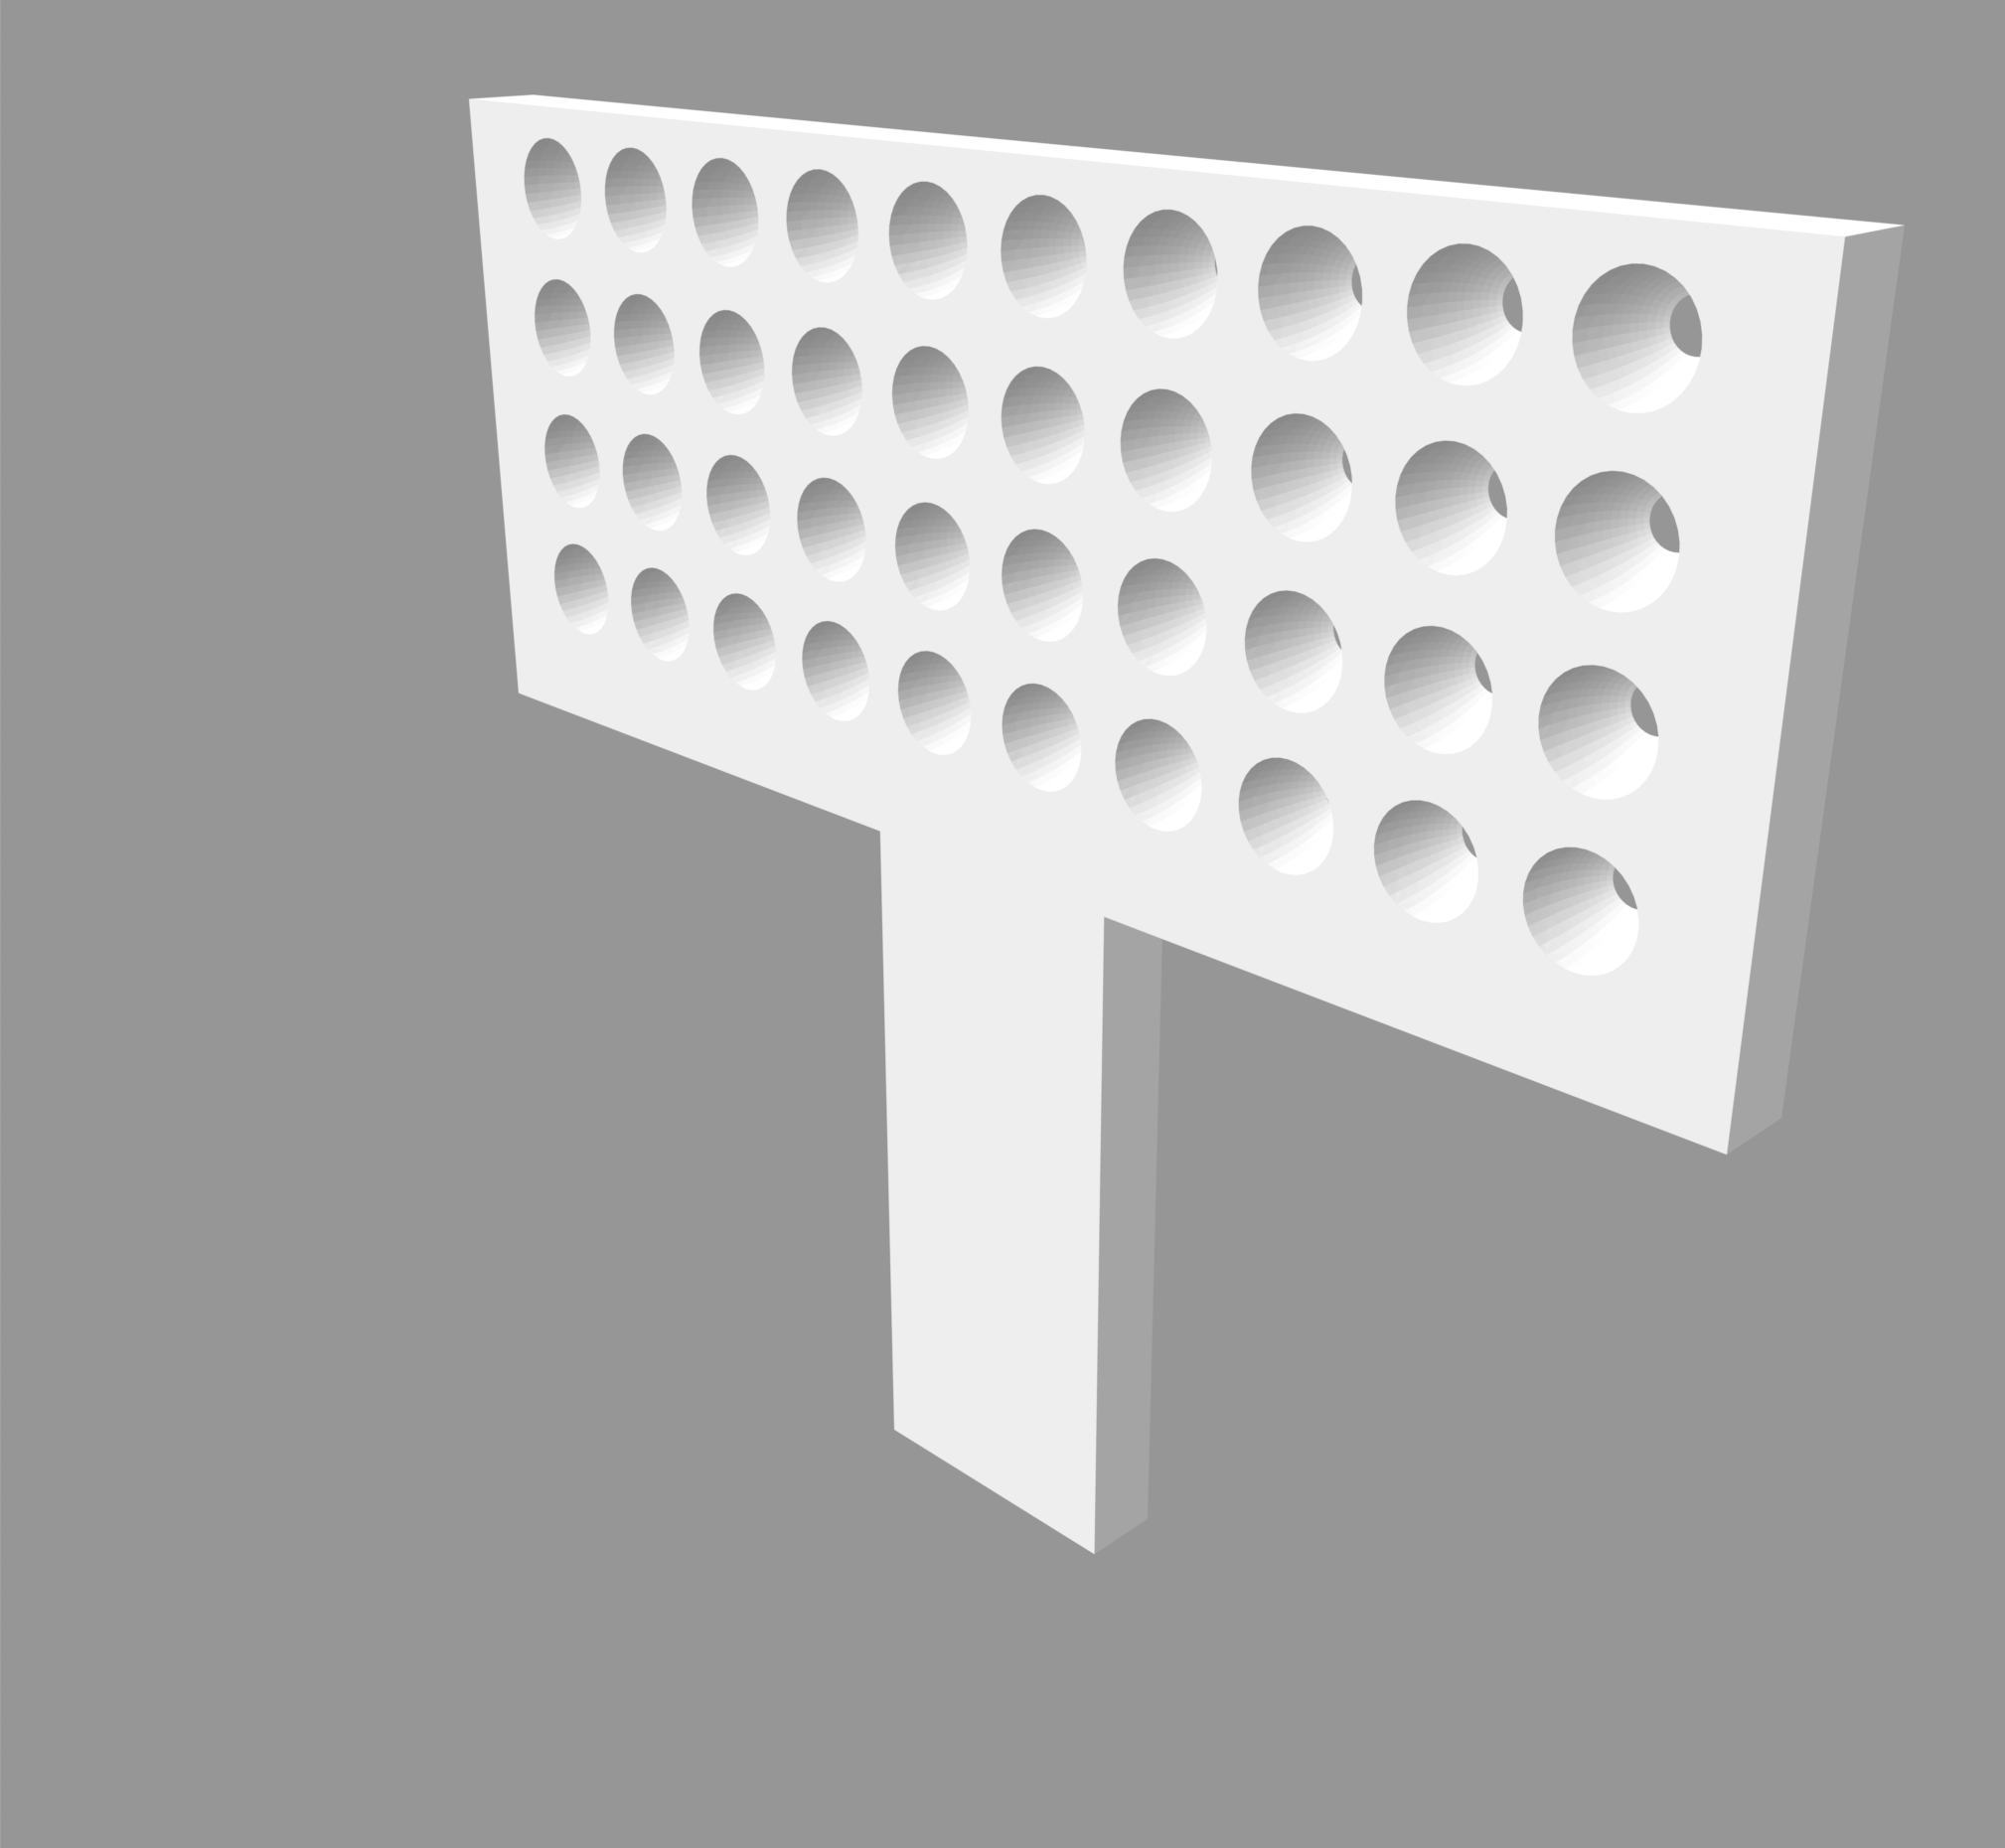
Download: Paddle Image