

“When are we ever going to use this?” This is one of the most often asked questions in a K-12 math classroom. A helpful resource for applying statistics to everyday life is Yummy Math. Activities can be used as a single lesson filled with rich discussion or a quick class opener. Yummy Math consists of examples that allow students to both create and interpret mathematical models from real data, and each lesson is aligned with the Common Core State Standards for Mathematics.
According to Adding It Up: Helping Children Learn Mathematics from the National Research Council, to be mathematically proficient requires the following five interwoven strands:
- Productive disposition
- Adaptive reasoning
- Conceptual understanding
- Strategic competence
- Procedural fluency
Although all strands are important, one that appears to get less attention in research is productive disposition, which is mentioned only within the introduction to the Common Core State Standards for Mathematics (CCSSM) practices, even though all the other practices rely on this strand according to the article “Whatever Happened to Productive Disposition?” by Maureen Grady.
According to the National Research Council, “Productive disposition refers to the tendency to see sense in mathematics, to perceive it as both useful and worthwhile, to believe that steady effort in learning mathematics pays off, and to see oneself as an effective learner and doer of mathematics.”
The Guidelines for Assessment and Instruction in Statistics Education (GAISE) documents published by the American Statistical Association also proclaim the importance of productive disposition:
Data and the stories that surround the data must be of interest to students! It is important to remember this when teaching data analysis. It is also important to choose data and stories that have enough depth to demonstrate the need for statistical thinking. For example, students tend to be interested in issues that affect their lives, and issues of health often fall into that category. News items are an excellent place to look for stories of current interest, including items on health.
One such resource for teaching statistics and seeing its value in everyday life is Yummy Math, which consists of examples that allow students to both create and interpret mathematical models from real data.
Yummy Math and Its Creators
The goal of the Yummy Math authors is to provide teachers with an easy way to bring real life into their math classrooms. It is their belief that when math is explored in contexts that are familiar and of interest to students, they will be more involved in doing math, reasoning, thinking critically, questioning, and communicating. The activities are written to correspond with the National Council of Teachers of Mathematics (NCTM) Process Standards and the CCSSM Content Standards and Mathematical Practices. The site includes more than 400 free documents in PDF format.
Yummy Math webmaster and co-creator Leslie Lewis is a retired math teacher with a special interest in art. Yummy Math co-creator Brian Marks is an instructional math coach in Newton, Massachusetts. He collaborates with and provides professional development for math and special education teachers. Marks taught math for 10 years before becoming a math coach. He and Lewis are committed to increasing student engagement, critical thinking, and discourse in the math classroom.
Yummy Math and Multiple Representational Theory
Richard Lesh, Thomas Post, and Merlyn Behr discuss a multiple-representation framework in “Representations and Translations Among Representations in Mathematics Learning and Problem Solving” that consists of real-world situations, manipulative models, pictures, written symbols, and spoken symbols to more clearly describe Bruner’s theory of learning. Translations within a node, such as from one manipulative (e.g., fraction circles) to another (e.g., chip model), are just as important as those between nodes (e.g., creating written symbols to represent a real-world situation). The framework used here is shown in Figure 1 and involves a combination of these five function representations with those of relevant situations.
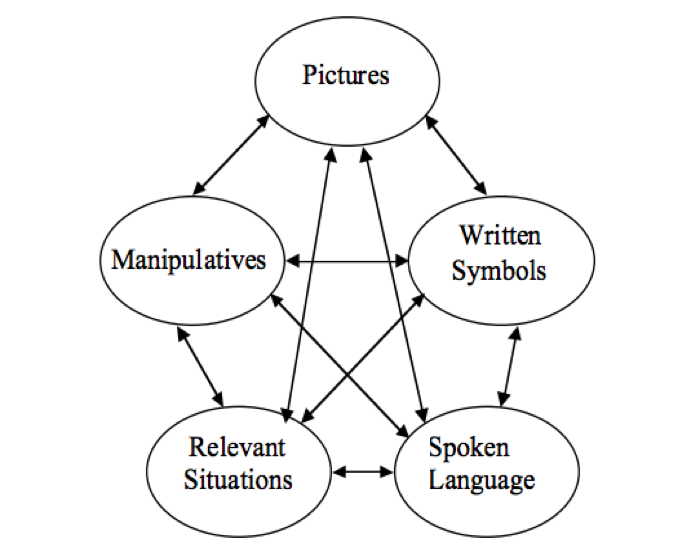
Pictures, manipulatives, written symbols, spoken language, and relevant situations are all important to learning. However, translations among the five representations are equally important in the transfer of knowledge. Arrows are important because they represent the connections students make between the representations. According to Lisa Clement in “A Model for Understanding, Using, and Connecting Representations,” students may be better able to access information about a mathematical idea when they make these connections because they have multiple ways to represent it and, thus, many points of access.
Through Yummy Math, many of the real-world applications are enhanced by connecting to representations such as graphs, tables, and audiovisual resources. An example of the connected nature of representations between and within relevant situations and pictures (graphs) is Deficit and Debt (PDF), in which the authors provide four graphs to illustrate aspects of the US economy.
Benefits of Using Yummy Math
Obvious benefits of Yummy Math that can be found by looking at the website include ease of navigation and relevance of pop culture in teaching statistics. Yummy Math provides mathematics lessons ranging from grades 2-12, organized by content (e.g., geometry, equations and expressions, statistics) and genre (e.g., weather, holidays, sports, art). All activities are created based on current events that offer real-world applications of interest to students. All the resources are free to use, although there is an annual fee of $20 to access the solution guides. These resources are continuously updated to keep up with current events, which are highlighted on the website’s homepage.
Within the Ohio Department of Education’s learning standards for mathematics, students are being encouraged to engage in the fourth mathematical practice of modeling by “solving problems that arise in everyday life, society, and the workplace” when incorporating mathematical problems that are current and relatable to real-world events. This connection to everyday life may help students see the importance and view math as useful and worthwhile.
Using Yummy Math in the Classroom
Yummy Math activities can be incorporated into the classroom in a variety of ways to enhance statistics teaching and learning.
In-class activities using current events and real data. The authors of Yummy Math create its lessons based on contexts, cultures, conditions, and languages that draw on students’ prior knowledge and experiences to show how math can apply to the everyday world. Approximately 95 lessons are categorized under the data and probability genre.
Teachers, scientists, behaviorists, and psychological anthropologists agree that learning is made meaningful by connecting topics to students’ personal, family, and community experiences. Many of the mathematical tasks and lessons include real-world statistical data sets within Excel documents for easy analysis. These lessons can be found under the data and probability genre tab.
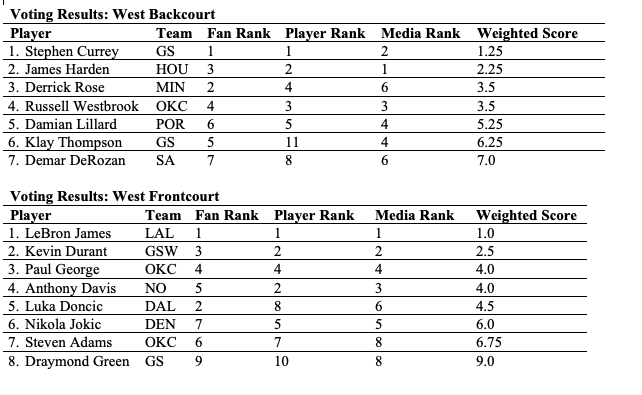
One example of a current event includes the lesson Choosing the NBA All-Star Team, in which students are given a chart that includes the following data on 15 players: team; fan rank; player rank; media rank; and weighted score (Table 1). Students are asked to determine how the weighted scores are calculated using formulas and then apply that formula to other player data, also discussing why the NBA may use this strategy to weight the players scores.
Table 1: Current Events and Real Data: Choosing the NBA All-Star Team
Within the NBA All-Star Team task, the following representations are identified (Table 2).
Table 2: In-Class Activities and Representations

Three-act tasks for statistics. A three-act task includes three distinct parts:
- An engaging and perplexing statistical question scenario based on a brief video clip or image
- Additional data
- Revelation, discussion, and extension of statistical understanding
During Act One, students are asked to express what they notice and wonder, pose questions, and make estimates toward reaching a solution. Within Act Two, students work toward reaching a solution as the teacher guides them with strategies that may be helpful and provides relevant data sets. At this time, students are given the opportunity to ask statistical questions relevant to a particular test they may run or data they may gather. Within Act Two, students engage in all the mathematical practices by persevering when posing questions, modeling with math, using tools strategically, making sense of structure, creating connections among mathematical concepts, reflecting on their work, and reasoning abstractly. In Act Three, students compare techniques and share their solutions, while the teacher reveals the answer through rich discussions that help validate those solutions. From here, extension problems may be used to help deep understanding and make further mathematical connections.
These rich questions require students to enter a problem solution from varying starting points and integrate multiple strands of mathematics to complete the task. These tasks require students to communicate, critique the reasoning of others, and defend their own reasoning. Since students do not approach a problem in the same way, these types of tasks offer a form of differentiation among student ability levels.
Carol Dweck in Mindset: The New Psychology of Success maintains that incorporating challenging tasks encourages a growth mindset, in which students engage in a healthy struggle while the teacher provides feedback and guidance within the classroom. Yummy Math provides 11 types of three-act tasks for statistics, which can be found through searching by grade level.
One example of a three-act task from Yummy Math is Stacking Jack. Act One begins with a short video and questions about how many ways students can stack Jack-or how many different color arrangements there are. Act Two requires students to pose questions such as the following:
- What information would be useful here?
- Can you use a problem-solving strategy such as solving a simpler version of the problem?
- Can you create an organized list?
- Can you model the possibilities with colored pencils or strips of paper?
After students pose questions, they are to try to determine answers to their questions using the data provided. At this point, the teacher can share a hint image with the class. Students may work individually, in partners, or in small groups to reach a solution. For additional help, teachers can share the video from Kahn Academy about permutations after students have had time to grapple with the number of arrangements. This video can help students reach a solution to the problem.
Within Act Three, the teacher reveals the solution to students and compares and contrasts this to their work:
Solution: Jack can be built in different ways. He has six parts that can be stacked in different orders. There are six ways you could choose the part to be on the bottom. After that piece has been chosen, there are only five pieces left to choose from for his second piece. Once those two pieces have been chosen, there are only four pieces to choose from for his next piece. Then only three pieces … then only two pieces … and finally only one piece to put right under his head. The number of ways to build Jack is 6 ∗ 5 ∗ 4 ∗ 3 ∗ 2 ∗ 1 = 6! = 720 ways.
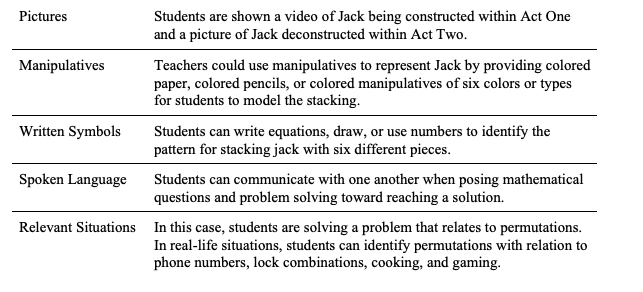
Within this three-act task, the representations in Table 3 are identified.
Table 3: Three-Act Task and Representations
All the three-act tasks provided on Yummy Math are correlated to grades six and seven statistics standards. Although these are the only two grades identified, these tasks can be adapted to meet a variety of student needs.
Final Word on Yummy Math
Although numerous online resources for teaching exist, few emphasize mathematical proficiency through the strand of productive disposition. Yummy Math incorporates current events and real data in teaching statistics. In addition, Yummy Math makes use of multiple representations that enable students to see the contextual nature of mathematics.
In her dissertation, “How and Why Teachers Use Real-World Connections in the Secondary Mathematics Classroom,” Suzanne Wuolle expressed there may not be a conclusive definition for real-world connections, while her research showed connections are made by teachers to motivate students, increase their interest, and build skills that can be transferred into the real world by fostering collaboration, independence, and communication. Yummy Math is such a resource.