
By Jessica Palmer, US Census Bureau
Did you know the population of the United States on April 1, 2020, was 331,449,281—an increase of 22,703,743—or 7.4 percent—from 2010? Or that California was the most populous state, with 39,538,223 residents, and Wyoming was the least populous, with 576,851 residents?
Fun facts like these are great conversational facts to share with your students and get them excited about data. The recent release of these and other 2020 Census results provides real-world opportunities to use the most up-to-date information about our nation’s population in your classroom.
From data visualizations to brief warm-up exercises to more comprehensive activities, the US Census Bureau has something available to fit the data needs of students at all levels. Start by exploring the latest state results to learn how your state or county data compares in areas such as population, housing, race, ethnicity, diversity, and age.
Pages can be easily shared and include multiple visualizations, so you view data through population density maps, bar charts, and more. You can also compare data points to 2010 Census results to see how your state or county changed over the decade.
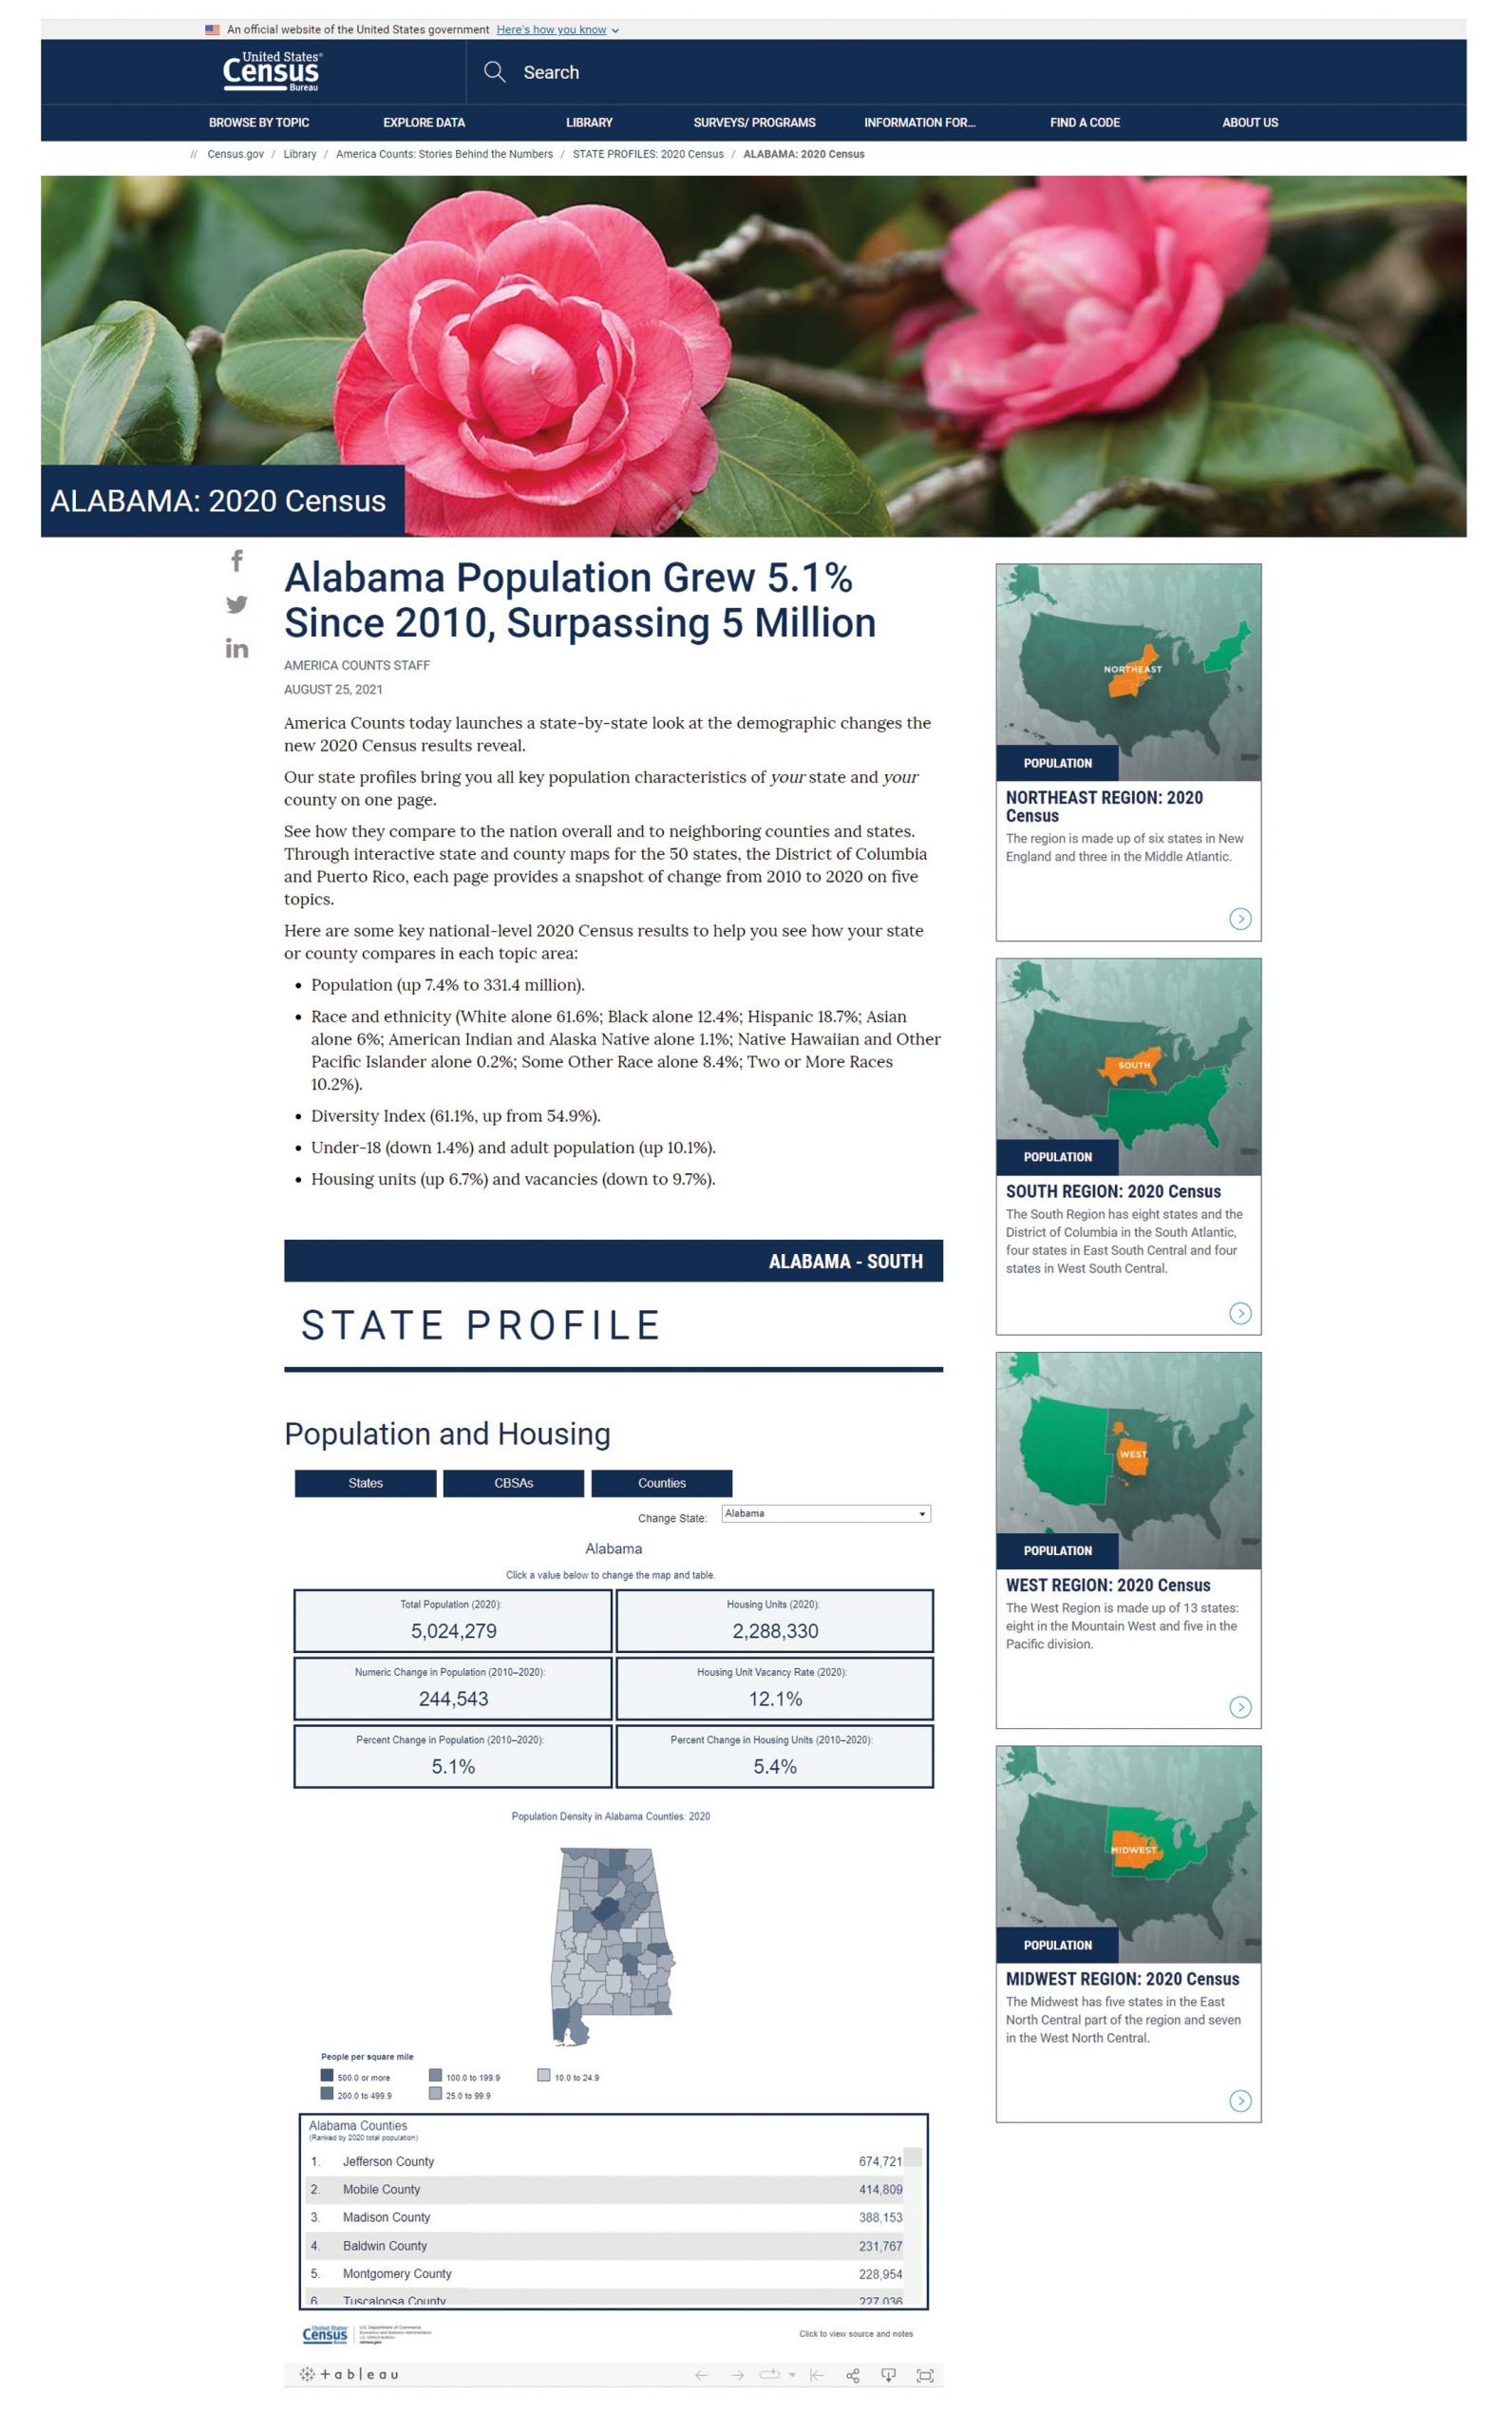
Following are key national-level 2020 Census results compared to 2010 results:
- Population (up 7.4 percent to 331.4 million)
- Race and ethnicity (white alone, 61.6 percent; Black alone, 12.4 percent; Hispanic, 18.7 percent; Asian alone, 6 percent; American Indian and Alaska Native alone, 1.1 percent; Native Hawaiian and Other Pacific Islander alone, 0.2 percent; some other race alone, 8.4 percent; two or more races, 10.2 percent)
- Diversity Index (61.1 percent, up from 54.9 percent)
- Under-18 (down 1.4 percent) and adult population (up 10.1 percent)
- Housing units (up 6.7 percent) and vacancies (down to 9.7 percent)
Examples of ways to incorporate the data into lessons include the following:
- My State: Then and Now. Students can create a chart with two columns, listing some of the key areas found on the state profile pages. Then, they can review the 2020 data for their state and compare it to 2010 data to see what has changed during the decade. Students can create a third column and list predictions about how their state will change by 2030.
- Diversity in My State. Students can review the diversity data presented on the state profile pages and identify changes in race and ethnic populations for their state and county using 2010 and 2020 census data. Students can make inferences from the data and discuss ways the changes might affect their communities.
You can find a variety of infographics and data visualizations on topics such as population and demographics, apportionment, and more. For example, this interactive visualization shows how the nation’s center of population has shifted since the first census in 1790.
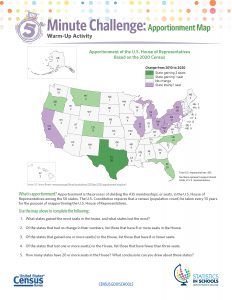
Once each decennial census ends, the results are used to calculate the number of seats each state is entitled to in the US House of Representatives based on its population. Each of the 50 states is entitled to a minimum of one seat. You can share more about the 2020 apportionment results with a five-minute warm-up challenge during which students examine an apportionment map and answer questions about their findings.
The Census Bureau also offers State Facts for Students, a data access tool geared toward younger students. This tool helps students discover fun facts about their state such as the change in its population from 1910 through 2020, the population of kids their ages, how people get to work, businesses there, and household computer use. It was recently refreshed and now provides multiple ways to examine the data through interactive data visualizations and tables. The familiar table view presents the data in a simple-to-use format that allows students to review and compare new and old data.
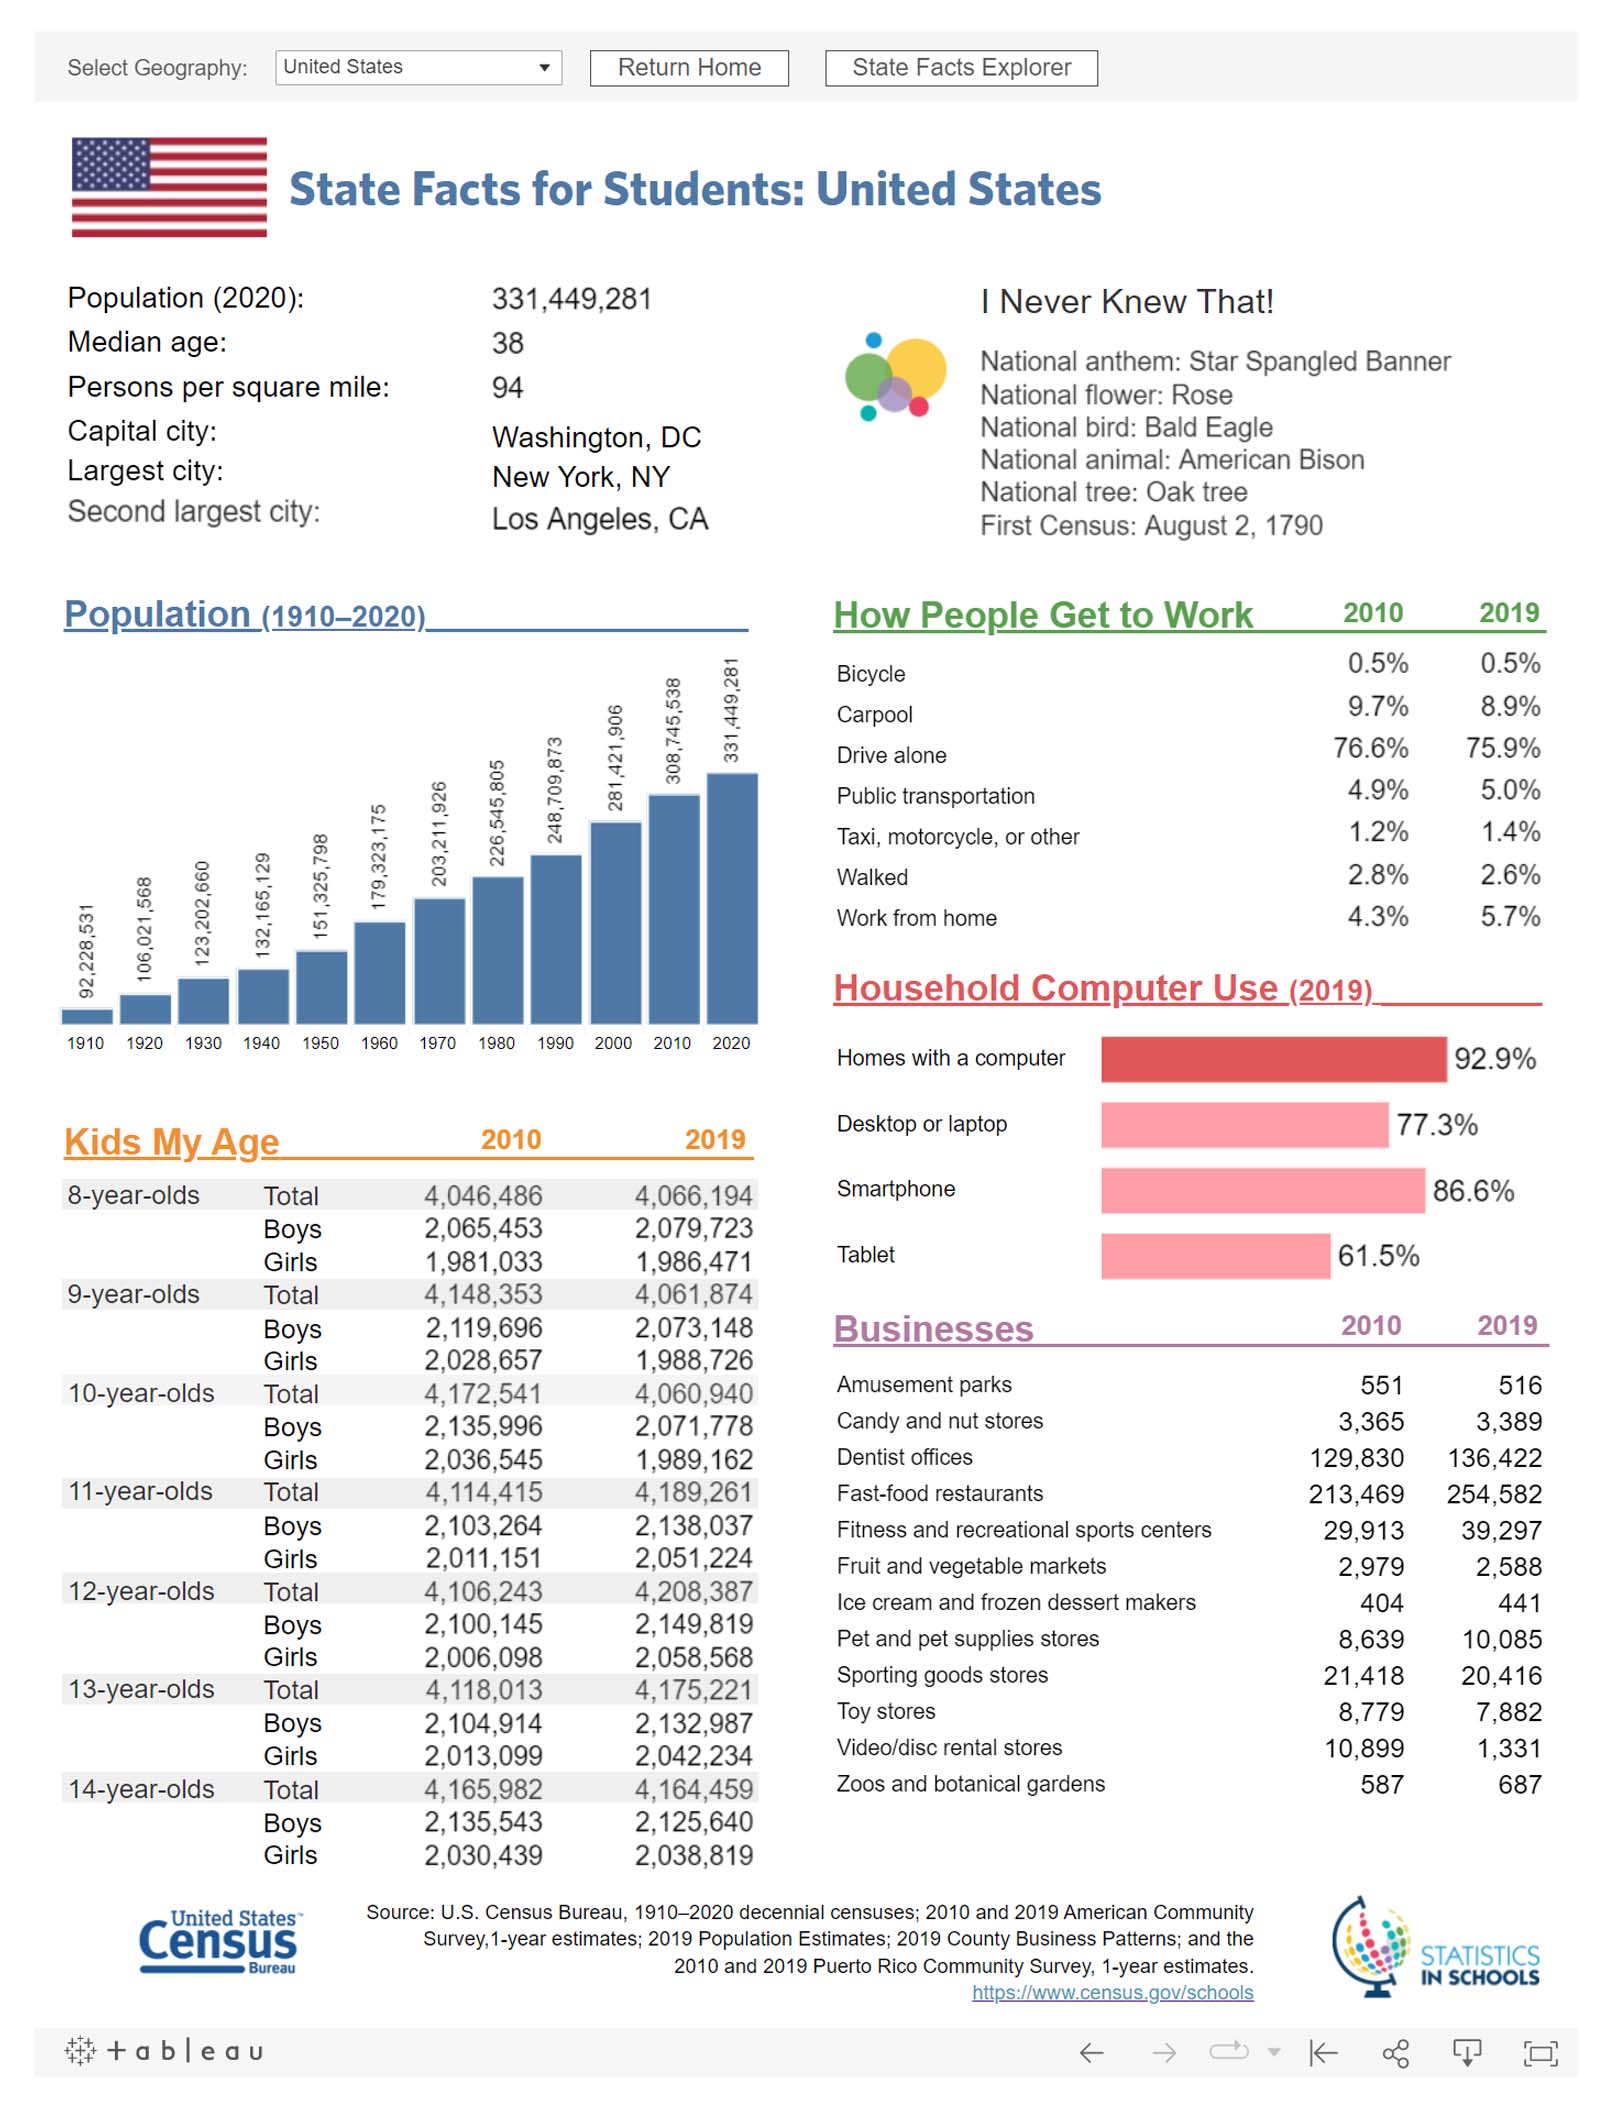
The explorer view is a new feature that takes students on a colorful journey along a road to view the data in a visually appealing way.

The Census Bureau’s Statistics in Schools (SIS) program offers a variety of standards-based activities using the State Facts for Students tool and can be seamlessly incorporated into classrooms. Following are examples of activities that use State Facts for Students:
Elementary Math
- Changes in My State. Learn about your state as you collect and organize business information about amusement parks, zoos and botanical gardens, and ice cream and frozen dessert makers.
- The Place of My State. Analyze the population data of your state and round the population numbers of multiple states to different place values.
- Using Fractions to Compare Amusements Parks by States. Predict how many amusement parks are in your state.
- Comparing My State. Compare data for two states using comparison symbols and both rounded and unrounded (exact) numbers.
- Looking at Numbers of Births Using a Line Graph: Look at census data and determine the birth years of children who were ages 8 to 11 in 2019.
Elementary Geography
- Scavenger Hunt: Where Is Gina the Geographer? Participate in an online scavenger hunt based on a story about a geographer named Gina who has escaped to an undisclosed location. Using a map, students follow clues to eliminate places where she is not to determine where she is.
Elementary/Middle English
- Numbers That Tell a Story: Explore data about your state and voice opinions about how the population has changed over time.
Teaching with census data gives students a deeper understanding of how statistics affect the world around them. From sports to fitness, statistics are used everywhere in our everyday lives. Using data with students gives them the opportunity to learn how it helps them make informed decisions.
Pique your students’ interest by introducing data in a visually appealing way. The Statistics in Schools program offers a variety of resources for K–12 classrooms, including math, history/social studies, geography, sociology, and English activities; 5-minute warm-up challenges; fun facts and teaching guides; and opportunities for virtual field trips to the Census Bureau.