

In this lesson by Douglas Whitaker, students explore nonlinear regression models to explain fish weight by using fish length. They will use both transformation of the response variable and polynomial regression. Geometric interpretations of variables are leveraged to suggest nonlinear models to fit. The intention of this lesson is for students to perform two or three linear … [Read more...] about Lesson Plan: Nonlinear Modeling: Something Fishy
9-12+
GAISE II Now Available; Download for Free

The Pre-K–12 Guidelines for Assessment and Instruction in Statistics Education II (GAISE II): A Framework for Statistics and Data Science Education is now available for free download. It can also be purchased via Amazon for $15. The GAISE II report presents a framework for statistics and data science literacy at the elementary-, middle-, and high-school levels and addresses … [Read more...] about GAISE II Now Available; Download for Free
A Sampling Activity to Anchor Big Statistical Ideas
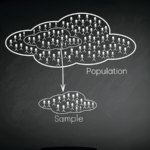
By Sandra Madden, University of Massachusetts - Amherst Have you ever gone looking for a highly productive and foolproof statistical reasoning task? In 2006, I designed a statistical sampling task for use in a professional development project. The intention was to showcase important statistical ideas, encourage conjecture and statistical argument, and illustrate the … [Read more...] about A Sampling Activity to Anchor Big Statistical Ideas
Lesson Plan: How Long Are the Words in the Gettysburg Address?

In this lesson by Gary Kader, Christine Franklin, Tim Jacobbe, and Kaycie Maddox, each student tries two methods for selecting a sample from the population of words in the Gettysburg Address: self-selection and simple random sampling. Then, as a class, students construct dotplots and calculate numerical summaries to show how sample means vary from sample to sample. Using … [Read more...] about Lesson Plan: How Long Are the Words in the Gettysburg Address?
Lesson Plan: The Mean and Variability from the Mean
The Pre-K-12 GAISE report emphasizes that students should be able to do more than just calculate summary statistics; they need conceptual understanding of those statistics that deepens as they progress through different levels of statistical literacy (Levels A, B, and C). The purpose of this activity is to develop students’ conceptual understanding of numerical summaries used … [Read more...] about Lesson Plan: The Mean and Variability from the Mean
2021 ASA Student Competitions

The ASA Data Visualization Poster Competition is for grade K–12 students to create a display containing two or more related graphics that summarize a set of data, look at the data from different points of view, and answer specific questions about the data. The submissions will be digital again this year. The deadline for posters is April 1, 2021. The ASA Statistics Project … [Read more...] about 2021 ASA Student Competitions
Teaching Module: People Count! (And Their Data Stories)
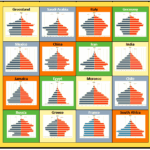
By Henry Kranendonk, Marquette University The US Census Bureau produced an inspiring set of posters for classroom teachers prior to the 2000 census. One of these posters remains a piece of art in my current classroom. The poster has a picture of an elderly woman and a young girl. They are wrapped in a quilt as representatives of two important generations in this country (the … [Read more...] about Teaching Module: People Count! (And Their Data Stories)
Focus on Statistics: Investigations for the Integration of Statistics into Grades 9–12 Mathematics Classrooms
Written by veteran teachers, this book includes 19 investigations to help you implement key statistical concepts in your classroom. Each investigation explicitly contains the four components of the problem-solving process presented in the American Statistical Association’s Guidelines for Assessment and Instruction in Statistics Education (GAISE) Report: A Pre-K–12 Curriculum … [Read more...] about Focus on Statistics: Investigations for the Integration of Statistics into Grades 9–12 Mathematics Classrooms
Lesson Plan: COVID-19: A Teachable Moment

Overview of Lesson At a time when nothing good can be said about COVID-19, Sara Brown, Patrick Hopfensperger, and Henry Kranendonk—authors of Focus on Statistics: Investigations for the Integration of Statistics into Grades 9–12 Mathematics Classrooms—have made available for free an investigation that can at least help students understand how the virus spreads. Investigation … [Read more...] about Lesson Plan: COVID-19: A Teachable Moment
Lesson Plan: A Tale of One City and Two Lead Measurements

By Kirk Anderson and Mary Richardson, Grand Valley State University Overview of Lesson In 2014, a crisis began when the city of Flint Michigan switched its water supply in an effort to save money and the water became contaminated with lead. The EPA’s Lead and Copper Rule states that if lead concentrations exceed an action level of 15 parts per billion (ppb) in more than … [Read more...] about Lesson Plan: A Tale of One City and Two Lead Measurements