
By Henry Kranendonk, Marquette University
The US Census Bureau produced an inspiring set of posters for classroom teachers prior to the 2000 census. One of these posters remains a piece of art in my current classroom. The poster has a picture of an elderly woman and a young girl. They are wrapped in a quilt as representatives of two important generations in this country (the young and the “old”). The picture also shows them working on expanding the quilt. The picture is a painting by a famous Hawaiian artist, Herb Kawaine Kane. The caption that accompanies the picture reads, “Generations Are Counting on You.” This poster was a major inspiration for this collection of lessons, titled People Count! (And Their Data Stories).
2020 is another important year for the US Census Bureau. As was the case in 2000, a census of the US population will be conducted. Years of planning will be implemented as the Census Bureau attempts to obtain an accurate count of the people. The accuracy and significance of this count is enormous. In addition to fulfilling a constitutional mandate for estimating fair representation in the House of Representatives (the “People’s House”), it also will be used to allocate and distribute resources and services needed by the country-resources and services that include medical care, education, food, and transportation.
People Count! (And Their Data Stories) is a collection of 16 lessons about counting people. This module evolved from several projects originating in my computer science and International Baccalaureate (IB) math studies classes at Rufus King High School in Milwaukee, Wisconsin. Working with real data, even if the data is not initially of high interest to students, brings out a response that captures students’ attention. This reaction was the case with my students. The initial lessons were expanded and refined over several years of students’ input and work.
People Count! was designed for students enrolled in a high-school algebra 2 or equivalent course, or an entry-level statistics or finite mathematics course in college. Prerequisite skills are essentially skills learned in first-year algebra courses. The latter lessons also involve applying and modifying Microsoft Excel files designed to estimate future counts of people. (It might be possible to use the files with other spreadsheet applications.)
The lessons and files support the main goal of this module, namely modeling with data. Students develop, analyze, and redesign population projection models using past and present population totals by age groups to estimate future population estimates of various countries. The data was obtained from the International Data Base (IDB), a resource of the Census Bureau.
Mathematics high-school and college teachers are often asked what important areas of mathematics students should learn. Generally, the discussion follows with an identification of specific skills or standards. This module addresses several skills and standards identified in the Overview of the Module, but the primary answer to that question is to describe a process of solving problems. This module is not solely about developing specific skills or standards; this module is about skills or standards working together to answer important questions. The process in which these components work together uses a tool, a modeling continuum, to evaluate and analyze the process of modeling based on students’ work.
In a broader sense, the modeling process as defined in this module is similar to the process of making a quilt. You start with tools and materials (needles, cloth, patterns), sketch out a design, and then assemble or build the quilt. Similar to making a quilt, it is the process that makes it an example of modeling. The tools in this module (i.e., proportions, ratios, median centers, mean centers, arithmetic, and geometric sequences) are used to build or rebuild population projection models. If you don’t have the right tools, or if you don’t know what tools you need, then you start with figuring out the tools and the materials. As students grow more comfortable with understanding the tools, they are more able to participate in one of the most important areas of mathematics-modeling.
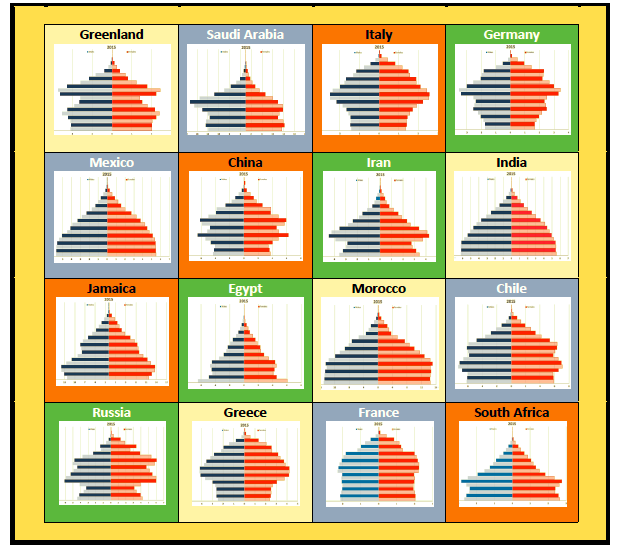
The front material motivates the over-arching theme of the text, or counting people over time. Students begin with a rather detailed analysis of the 2015 counts of the United States and two other countries (Kenya and Japan), exploring each country’s shape as visualized by their population pyramid graphs and resulting histograms. The significance of the shape and spread of these graphs is further explored in the lessons.
A general description of the units is provided below:
Unit 1: A Country’s Shape
This unit defines shape based on the population distribution as displayed by a country’s population pyramid graph and resulting histogram. Specific age groups are analyzed to highlight significant features of each country’s population. Summaries include the age groups representing the greatest percent of the population, a ratio of old-to-young, and general descriptions based on the defined shape of a country. The implications of these summaries are also developed in the problems.
Unit 2: Looking Back
A country’s shape is a result of many factors that emerge by studying the past and the most current population pyramid graphs and histograms. This unit develops a timeline that analyzes both past distributions and the resulting connection to 2015. In Lesson 6, the timeline identifies the emergence of two significant subgroups that result in the unique shape of the United States population distribution-namely, the Baby Boom Generation and the Millennial Generation. Events that resulted in a change in the count of people over time are identified in the lessons and traced through several decades.
Unit 3: Looking Forward
This unit builds on the analysis of past distributions in deriving estimates of future counts. Students are challenged in each lesson to explain the factors behind each new iteration of a population projection model. The unit begins by developing an arithmetic sequence based on the 2010 and 2015 population totals. Lesson 8 summarizes this sequence with a linear model used to estimate the future population totals. A geometric sequence is used to derive an exponential model in Lesson 9. Each of these lessons, however, does not obtain estimates for the age groups. Although possible to derive age group estimates using these models, the age group analysis begins in Lesson 10 with the special recursive model designed for this module.
Lesson 10 introduces an important feature of the recursive model identified as population factors. Applying these factors to build estimates of future age groups is done in Lesson 11. Lesson 12 completes the recursive model by developing foundation factors that fill in the “hole” left by the 0-4-years-old age group in each iteration. As this hole is derived, the resulting projections based on population factors are completed. Lessons 13 and 14 build off these estimates to summarize the shapes and projected changes in the population of the United States, Kenya, and Japan.
Unit 4: ‘What If …?’
The ultimate goal of any model is to provide possible answers to “What if …?” questions. A working model is now in place. What if the population factors and foundation factors noted in the set-up of the recursive model continue? What if they change? What if fewer counts of people move into a country? What if economic conditions require more workers? What if a downturn in the economy results in people having fewer children? These and several similar questions are explored in this unit. Students are expected to apply the tools they learned to rebuild the recursive model and answer these types of questions. Students are also expected to be able to articulate what changes they propose to the original model and why they propose those changes. The two lessons designed in this unit, and the concluding wrap-up section, are putting students in control of the model.
Conclusion
Counting people may initially strike students as both simple and relatively “easy.” People Count! connects real people to this process and develops with students’ reasons why this process is important and a major challenge. Some people have actually stated that the survival of the United States is dependent on making sure counting people is done correctly.
Download the Module
Download: Front Material
Download: Overview of the Module
Download: Introduction to the Module
Download: Unit 1
Download: Unit 2
Download: Unit 3
Download: Unit 4
Download: Handouts
Download: Excel Projection Files
Download: Quilt of Countries
Download:Complete Student Edition
Download:Complete Teaching Notes