

By Tim Jacobbe, Southern Methodist University; Chris Franklin, University of Georgia; Gary Kader, Appalachian State University; and Kaycie Maddox, Northeast Georgia Regional Educational Service Agency Overview of Lesson This investigation focuses on students conducting a comparative experiment to explore whether there are meaningful differences between the number of times … [Read more...] about Lesson Plan: Exploring Whether a Difference Is a Meaningful Difference
6-8
Using 2020 Census Data in Your Classroom
By Jessica Palmer, US Census Bureau Did you know the population of the United States on April 1, 2020, was 331,449,281—an increase of 22,703,743—or 7.4 percent—from 2010? Or that California was the most populous state, with 39,538,223 residents, and Wyoming was the least populous, with 576,851 residents? Fun facts like these are great conversational facts to share with … [Read more...] about Using 2020 Census Data in Your Classroom
Revealing the Power of Data Visualizations in Social Studies Through Slow Reveal Graphs

By Kristen Taurence, Tamara Shreiner, and Bradford Dykes, Grand Valley State University Data visualizations cut across many disciplines and, as stated in the GAISE Pre-K–12 Report, more disciplines are incorporating statistical reasoning within their standards. In fact, data visualizations are ubiquitous in social studies education. Social studies textbooks and online … [Read more...] about Revealing the Power of Data Visualizations in Social Studies Through Slow Reveal Graphs
Lesson Plan: Using Photographs as Data Sources to Tell Stories About Our Favorite Outdoor Spaces

Pip Arnold, Sheri Johnson, and Leticia Perez all started with the same initial prompt: Use photographs as data. The result? Three lesson plans that show it is possible to take an idea and develop it to best suit the interests of your students and you. All three lessons are aimed at the grades 6–9. You may like to work with one lesson plan or pick elements of all three to use … [Read more...] about Lesson Plan: Using Photographs as Data Sources to Tell Stories About Our Favorite Outdoor Spaces
GAISE II Now Available; Download for Free
The Pre-K–12 Guidelines for Assessment and Instruction in Statistics Education II (GAISE II): A Framework for Statistics and Data Science Education is now available for free download. It can also be purchased via Amazon for $15. The GAISE II report presents a framework for statistics and data science literacy at the elementary-, middle-, and high-school levels and addresses … [Read more...] about GAISE II Now Available; Download for Free
A Sampling Activity to Anchor Big Statistical Ideas
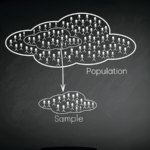
By Sandra Madden, University of Massachusetts - Amherst Have you ever gone looking for a highly productive and foolproof statistical reasoning task? In 2006, I designed a statistical sampling task for use in a professional development project. The intention was to showcase important statistical ideas, encourage conjecture and statistical argument, and illustrate the … [Read more...] about A Sampling Activity to Anchor Big Statistical Ideas
Data Interrogations for Critical Statistical Literacy

By Susan O. Cannon, Mercer University The classroom was unusually quiet, especially for a middle school. The only sound was that of pencils rushing across paper as students looked back and forth from the image projected on the screen to their papers. The image showed a refugee camp. Tents with the United Nations emblem stretched out in the background, and two women and three … [Read more...] about Data Interrogations for Critical Statistical Literacy
Lesson Plan: How Long Are the Words in the Gettysburg Address?

In this lesson by Gary Kader, Christine Franklin, Tim Jacobbe, and Kaycie Maddox, each student tries two methods for selecting a sample from the population of words in the Gettysburg Address: self-selection and simple random sampling. Then, as a class, students construct dotplots and calculate numerical summaries to show how sample means vary from sample to sample. Using … [Read more...] about Lesson Plan: How Long Are the Words in the Gettysburg Address?
Lesson Plan: The Mean and Variability from the Mean
The Pre-K-12 GAISE report emphasizes that students should be able to do more than just calculate summary statistics; they need conceptual understanding of those statistics that deepens as they progress through different levels of statistical literacy (Levels A, B, and C). The purpose of this activity is to develop students’ conceptual understanding of numerical summaries used … [Read more...] about Lesson Plan: The Mean and Variability from the Mean
2021 ASA Student Competitions

The ASA Data Visualization Poster Competition is for grade K–12 students to create a display containing two or more related graphics that summarize a set of data, look at the data from different points of view, and answer specific questions about the data. The submissions will be digital again this year. The deadline for posters is April 1, 2021. The ASA Statistics Project … [Read more...] about 2021 ASA Student Competitions