

By Cole Nussbaumer Knaflic Imagine a world in which numbers and data come alive to solve problems, spark curiosity, and tell captivating stories. In this world, math isn’t boring or intimidating—it’s vibrant and full of possibilities, unlocking colorful and creative ways to understand the world around us. This is the world of Daphne, the data-drawing dragon. Daphne … [Read more...] about Graphing with Kids: Teaching the Superpower of Numbers and Data
K-5
ASA/NCTM Joint Committee Members Share Favorite Resources, Ideas

Data-Driven Minds: Prepping Students for a Smarter Future How can teachers design data-centered classrooms to empower their students? What strategies and tools can help increase data literacy and data science in K–12 education? How do teachers bring a focus to data-centered instruction in their math classrooms? How can data science be related to music and cooking? These … [Read more...] about ASA/NCTM Joint Committee Members Share Favorite Resources, Ideas
A Guided Lesson on Fake News for Improving Statistical Literacy

By Rebecca Pierce, Ball State University, and Matthew Brenneman, Embry Riddle Aeronautical University The goal of the GAISE: Pre-K–12 Report is statistical literacy for all. But statistical literacy is not achievable unless students understand why they personally need to learn statistics. One could cite high-paying jobs in data science as a motivation, but this pertains to … [Read more...] about A Guided Lesson on Fake News for Improving Statistical Literacy
Census Bureau Offers Classroom Resources
By Jessica Palmer, US Census Bureau Did you know the United States exported approximately $60.9 million in pumpkins, squash, and gourds in 2022? Use facts such as this to supplement what you are teaching this fall with the US Census Bureau’s Statistics in Schools program. These resources can help you prepare for the remainder of the year while encouraging statistical … [Read more...] about Census Bureau Offers Classroom Resources
Lesson Plan: If You Only Have One Hour … Teaching Statistical Inference to Youth

By Beth Chance, Elsa Medina, and Jacquelyn Silverbush, Cal Poly, San Luis Obispo Statistical inference is the science of drawing conclusions beyond observed sample data to a larger population or process. In a college statistics course, students learn about probability, confidence intervals, and p-values and apply these ideas to research studies. The article “Assessment of … [Read more...] about Lesson Plan: If You Only Have One Hour … Teaching Statistical Inference to Youth
GAISE II Now Available; Download for Free
The Pre-K–12 Guidelines for Assessment and Instruction in Statistics Education II (GAISE II): A Framework for Statistics and Data Science Education is now available for free download. It can also be purchased via Amazon for $15. The GAISE II report presents a framework for statistics and data science literacy at the elementary-, middle-, and high-school levels and addresses … [Read more...] about GAISE II Now Available; Download for Free
Lesson Plan: The Mean and Variability from the Mean
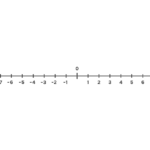
The Pre-K-12 GAISE report emphasizes that students should be able to do more than just calculate summary statistics; they need conceptual understanding of those statistics that deepens as they progress through different levels of statistical literacy (Levels A, B, and C). The purpose of this activity is to develop students’ conceptual understanding of numerical summaries used … [Read more...] about Lesson Plan: The Mean and Variability from the Mean
2021 ASA Student Competitions
The ASA Data Visualization Poster Competition is for grade K–12 students to create a display containing two or more related graphics that summarize a set of data, look at the data from different points of view, and answer specific questions about the data. The submissions will be digital again this year. The deadline for posters is April 1, 2021. The ASA Statistics Project … [Read more...] about 2021 ASA Student Competitions
A Technology Twist on a Classic Statistics Lesson

By Shelly Sheats Harkness, Sarai Hedges, Kim Given In the lesson, “Alphabet Statistics,” described by Marilyn Burns in her 1987 book, A Collection of Math Lessons (from grades 3 through 6), students explore letter-of-the-alphabet frequency of usage in print material. Over the years, Shelly Sheats Harkness used an adaptation of this lesson several times with middle-school … [Read more...] about A Technology Twist on a Classic Statistics Lesson
Developing Authentic Assessments
Developing authentic formative and summative assessments is challenging, so this column will focus on suggestions for lesson-specific assessments to overarching frameworks. The Guidelines for Assessment and Instruction in Statistics Education (GAISE) Report: A Pre-K–12 Curriculum Framework, published in 2007, remains an important resource for developing authentic … [Read more...] about Developing Authentic Assessments