

By Beth Chance, Elsa Medina, and Jacquelyn Silverbush, Cal Poly, San Luis Obispo
Statistical inference is the science of drawing conclusions beyond observed sample data to a larger population or process. In a college statistics course, students learn about probability, confidence intervals, and p-values and apply these ideas to research studies. The article “Assessment of Informal and Formal Inferential Reasoning: A Critical Research Review” by Maria Guadalupe Tobías-Lara and Ana Luisa Gómez-Blancarte provides insight into how to build students’ informal and formal reasoning about inference. However, what if you only have one day with younger students? Can you give middle-school students a meaningful glimpse of this foundational topic? Can you begin to introduce the language and ways of thinking needed for this future work?
We recently had the opportunity to teach a few ‘elective classes’ to kids in grades 4–6 at a local elementary school. We decided to explore whether we could help these students think inferentially in this more informal setting. In particular, we wanted to know what tools are needed to get them there. We reviewed several useful resources on modeling and inference for ideas, as well as our own materials and prior research.
If You Only Have One Hour: Could this have happened by chance alone?
In the algebra-based introductory statistics course the first author has been teaching for several years, she has explored teaching students about statistical inference on day one of the course. This involves introducing a genuine research study about a binary variable (e.g., Can dolphins communicate abstract ideas?), examining data from the study, and drawing conclusions. In the lesson she gives, students flip coins to represent dolphin choices under a ‘just guessing’ model. After each student has flipped their coin 16 times to match the number of attempts in the study, students can be asked how many found 15 or more heads (15 was the observed number of correct communications in the actual study). Once students see how few sets of coin tosses (if any) achieved a similar result, they can begin to reason that the dolphins in the actual study performed better than random chance alone.
Teacher: “What do you think about getting 15 correct by random chance alone?”
Student: “Fifteen has a very, very, very small chance of happening.”
Teacher: “What about if Buzz [the dolphin] only had gotten Nine correct?”
Student: “Nine happens kind of enough so it’s not too surprising.”
We have found college students can understand the logic behind this approach, often suggesting the coin-tossing model themselves. We think this gives students a quick preview to a way of thinking (“Could this have happened by chance alone?”) that occurs all around them and helps them see why understanding randomness and variability is important in evidence-based decision-making. The above exchange, after Day 3 of the elective, suggests such reasoning is feasible to instill in younger children, as well.
If You Have Two Hours: Technology-enhanced inferential reasoning
After introducing students to this way of thinking, you can then turn to technology to help them see the ‘long-run behavior’ of the coin-tossing model. In our case, we used a slightly simplified version of the One Proportion applet from the Rossman/Chance collection. A useful feature of this applet is a visualization of coin tossing, to help convince students that the computer is carrying out the exact same process they did with physical coins, just much faster. As students use the applet to gradually build a distribution of counts, a good question for the class is how many repetitions are needed for the distribution to ‘settle down’ to a predictable pattern. From this distribution, students again see that a result as extreme as 14 is unlikely in the coin-tossing model. With advanced students, you could have them quantify how unusual this behavior is by using the applet to count how many of the generated repetitions are at least as extreme as 14.
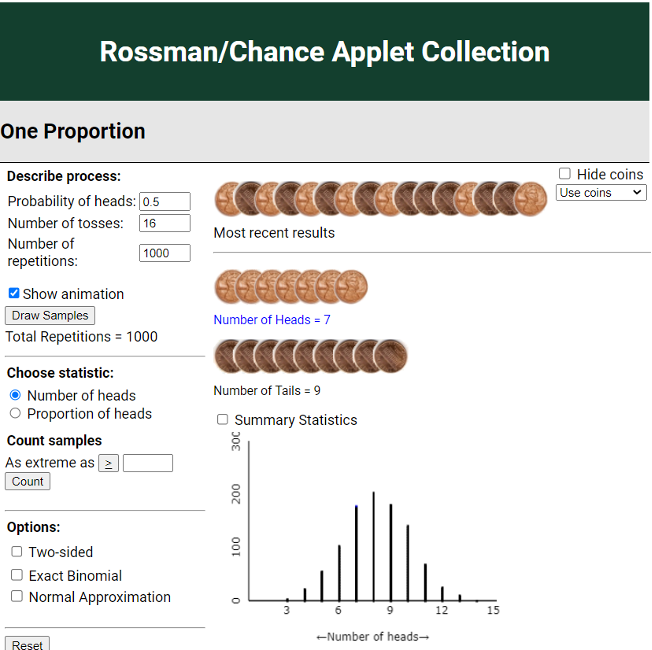
After seeing this picture, one student wrote, “I don’t think he was guessing because the chances of him getting 15/16 by guessing is like 0.00001.” With younger students, we suggest focusing on whether the observation is in the tail of the distribution. If a student asks, you can try to highlight that the tail probability (the “p-value”) is more comparable across studies with different sample sizes. Otherwise, the probability of any one specific value gets increasingly smaller as the sample size increases.
As a follow-up, we tell students about another trial of the study in which the dolphins were correct in only 16 of 28 trials and they can investigate how this is not an unusual outcome in the coin-tossing model. It turns out, the fish-reward mechanism malfunctioned.
If You Have Three Hours: Using simulation models to explore patterns in randomness
We next introduced students to a study about whether dogs can sniff out breath samples belonging to cancer patients (including a video of a recent news report). In such studies, dogs are given repeated trials in which one of five bags belongs to a cancer patient and the dog is trained to sit next to that bag.
This extends the same reasoning students used above to a non-50:50 case. Students can brainstorm how they would simulate the just guessing outcomes. We found they eventually suggest using a die or spinner they are familiar with from elementary school. After a tactile simulation, students can again move to the computer to generate a distribution to compare their results. (The One Proportion applet changes to spinners.)
We think the tactile simulation is an important component of these examples, but asking students to come to the board to share their simulation results is especially important. This directly involves students in the process and helps their ability to describe it. We also recommend using a technology tool that maintains the connection to the tactile simulation, rather than one that becomes too abstract or a black box.
If You Have Four Hours: Start with appreciation of variability
The suggestions above do not require students to have any prior understanding of statistics. However, we do think there are topics that could be discussed or reviewed first that would enable students to better understand these big ideas. With more time, we don’t recommend introducing the formal language of inference. Instead, we suggest asking students to take their own measurements so they experience variability first-hand, and then discuss how to make valid decisions, even in the presence of variability.
In our elective course, we modified an activity about measurement and variability from Activity-Based Statistics. Students were asked to make measurements of various objects in the classroom (e.g., table circumference, teacher’s head) with rulers or tape measurements. Such tasks are part of the K–6 curriculum, but we think it’s also important to have students discuss how and why their measurements are differing. Our students were quick to suggest strategies such as the mean for summarizing the results.
As recommended by Michael Shaughnessy in Research on Statistics Learning and Reasoning, a chapter in Second Handbook of Research on Mathematics Teaching and Learning, such discussions should also consider and compare variability in the results. This activity gives students the opportunity to apply what they are learning in the Math Common Core State Standards for grades 4–6 (e.g. 6.SP) through examining dotplots of the results and thinking about the reliability of the measurements and how this could relate to the appropriateness of different measurement tools. Given free reign to ‘make a visual display’ of their results, most students were able to make a reasonable display, and we were surprised by the variety of approaches, laying the groundwork for future discussion of relative merits of different displays.
Another activity we tried here was “Can Rats Beat Humans,” adapted from Statistical Thinking: A Simulation Approach to Modeling Uncertainty. We used an animated gif to flash a sequence of 10 red or green squares on a webpage, and then asked students to predict the next 10 outcomes. Students were asked to write down an explanation of their strategy. After the next 10 squares were shown, they compared their guesses to the actual results and evaluated their strategy. We then discussed how ‘humans’ tend to look for patterns in the individual outcomes and try to match those patterns, whereas rats will see which color is most common in the first sequence (e.g., 70 percent green) and use that information to predict that color to reappear. Students can then see how the rats’ strategy has a higher probability of success than the ones they devised.
With primary students, we used the handouts as reminders of discussion points, rather than expecting students to write out their strategies in detail. We think having them think about ideas of randomness and predictability in a fun game-like environment was worthwhile and a good start to using the informal language needed to discuss these ideas. With secondary students, we advocate having them write out and defend their conclusions, starting with some initial sentence structures to build on.
If You Have Five Hours: Start with describing distributions
For another precursor lesson, we recommend giving students more experiences with collecting data and creating distributions to help them visualize distributions as individual entities with interesting features and properties. To accomplish this, we had the students take more measurements (forearm length and foot length to test Da Vinci’s claim of equality). We also discussed the following distributions we thought had compelling features:
- Weights of the men’s Olympic rowing team and why there is one much lighter rower (the coxswain) and different clusters (different weight classes)
- Dotplots of dinosaur heights used in the original Jurassic Park novel as the first clues that the dinosaurs were not as controlled as the park’s creator wanted others to believe
- Distributions of temperatures for different cities and comparing averages and variability and how that might affect where you would choose to live
Then, we asked students to play detective and match different dotplots (with no numbers, only the distribution) to variables such as the following:
- How much did you like the last Jurassic Park movie you saw on a scale of 0–9?
- How many brothers and sisters do you have?
- What is the last digit of your phone number?
Overall, we think these conversations about different variable behavior are rich and serve as a reminder for students (and teachers) of inherent differences between statistical and mathematical thinking.
If You Have Six Hours: Focus on modeling
With time for additional precursor lessons, students benefit from more discussion of randomness and patterns. You can also use the same technology tools to allow them to become familiar with them before transitioning to statistical inference. In general, we advocate for more discussion in lower grade levels about ideas of modeling, strengths and weaknesses of different models, and how models help us make comparisons and decisions.
In our elective class, we tried another activity from Activity-Based Statistics. We asked students to toss coins and write down the sequence of heads and tails, as well as (potentially by students) make up what they thought such a sequence might look like. With younger students, we shortened the length of the sequences, but this will also make some patterns harder to see. This initial step can be assigned for outside class to save time.
Once students have the two types of sequences, they are asked to determine the longest run of heads. At this point, you can have a volunteer leave the room, and then the students will create the two dotplots—one of the results for the actual sequence and one for the results of the made-up sequences—randomly deciding which is displayed on top and which is on the bottom. The volunteer returns and (ideally) can quickly identify which sequence is which.
We hoped this would convince students of the power of some knowledge of randomness, though with lower grades this was not as successful and the ‘teach by surprise’ element not as strong as we hoped. Possible improvements include using longer sequences so the distinction between the longest runs is clearer, as well as using an application context that is more engaging to students at this grade level.
Then, we had students use the One Proportion applet (their first time) from the Rossman/Chance applet collection to generate distributions of longest run of heads.
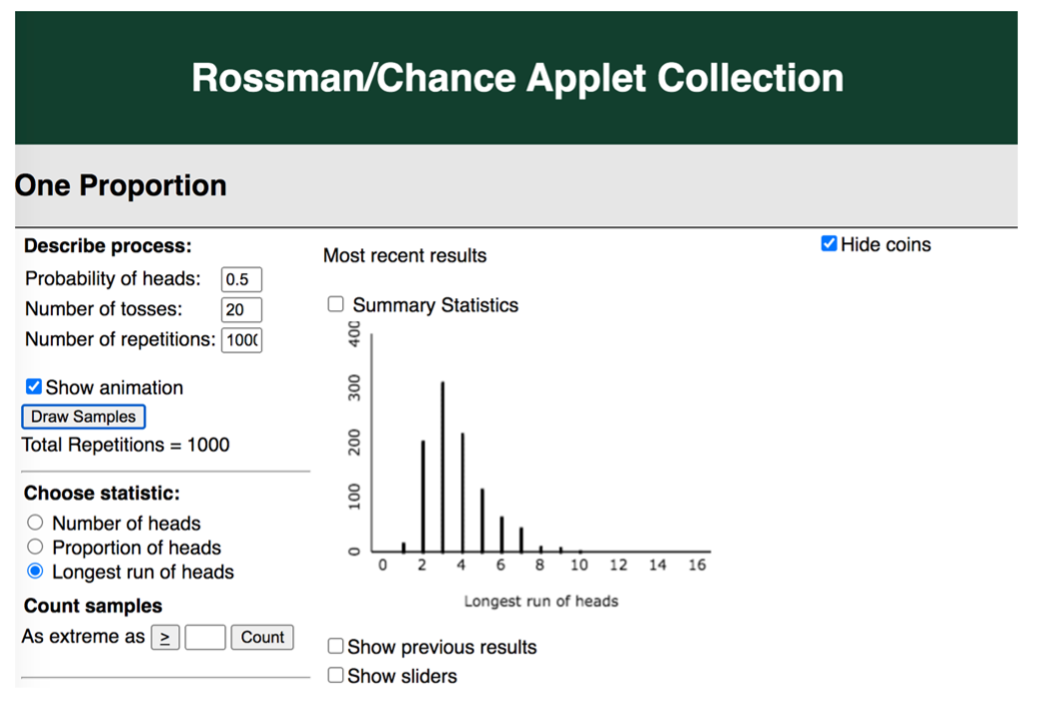
We thought this would help introduce the students to the idea of computer simulation, and these students were always happy to play with the applets.
In this same lesson, we had students explore the Monty Hall problem. We constructed a system of three doors by hanging index cards from a bent coat hanger with laundry pins and had a few students play the game live (providing pizza coupons to the winners).
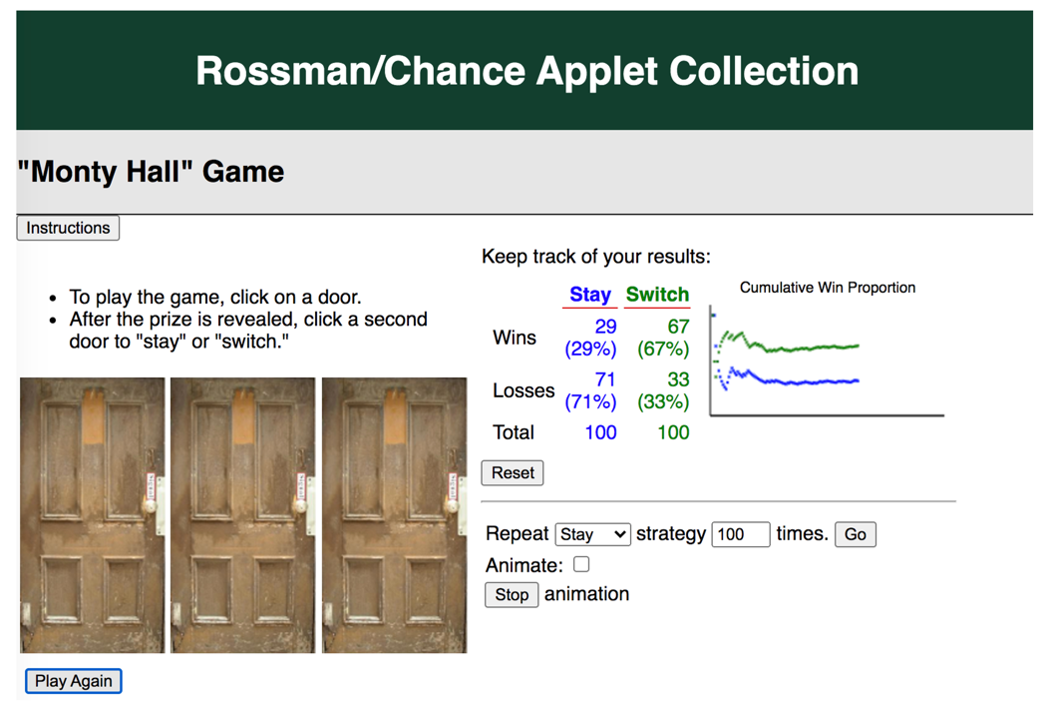
Then, we used the Monty Hall applet from the Rossman/Chance applet collection to play many more rounds and compare the stay and switch strategies. The students found this activity engaging, and we think the idea of ‘in the long run’ was reinforced. To apply this knowledge, we often ask students, “If I told you there was a 20 percent chance of rain, what is that telling us?”
With More Time
We used the following additional activities with these young students:
- ESP cards: You can purchase cards that have five symbols and ask students to test each other’s extra-sensory perception. This is a fun data-collection activity, and going to an applet or carrying out a more formal analysis may not be necessary because the results are not as impressive or in the wrong direction—an important reminder for students. We also used ‘trick’ cards (e.g., Penguin Magic) where the instructor can always identify the correct symbol. Students became very engaged in figuring out how the instructor was able to do it, not believing she had ESP. This can also lead to rich discussions of randomness and evidence.
- We attempted to get these students to a “goodness of fit” test to answer whether births occur equally across the seven days of the week. We asked students to collect birth dates of a few friends and family members before class, and then we would use an online birthdate calculator to determine the corresponding day of the week. Students were interested in the question, but most failed to bring in data. However, this turned into a fun class activity of looking up birthdays of famous people. Tallying the results and thinking about how they compared to the expected counts was also engaging. We gave students another applet that randomly generates days of the week that are equally likely so they could use bar graphs to compare but found that asking students to summarize the comparison with one statistic (e.g., the maximum tally) was beyond what they were ready for.
- In the early lessons on measurements, we had students carry out the penny drop experiment—conjecturing how many drops of water can fit on the head of a penny. Students used 16 pennies, eight with soap water and eight with plain water. We returned to this data on the last day of the elective and again demonstrated another applet to judge whether the (quantitative) results could have happened by chance alone. Students were able to grasp the idea of using simulation to assess how unusual their observed outcome was (“We can use index cards.”) and commenting about the plausibility of the result by chance alone.
Teacher: “Is this value (the difference in group means) possible?”
Students: “Yes!”
Teacher: “Is it believable?”
Students: “No!”
While there were still some misconceptions during this activity, students appeared to appreciate analyzing data they had collected themselves.
While these last activities may have been beyond the beginning student, we think it’s still motivating for students to think and reason about questions involving randomness, which are substantially different than the traditional mathematics questions and have different language needs that teachers can begin preparing students for in lower grades. Such activities can help motivate students to ask better questions and for more lessons in statistics and mathematics in general. Overall, we did anecdotally see evidence in growth in students’ inferential reasoning. Even if this topic is not on the course curriculum, we think the use of genuine data and interesting research contexts can motivate deeper discussion of topics in data analysis and probability.
Lesson Plan: How Random Is That?
Download: Day One
Download: Day Two
Download: Day Three
Download: Day Four
Download: Day Five