
This issue of Statistics Teacher features a trio of articles that provide guidance for making use of real data sets and interpreting data representations in context. Hollylynne Lee, Gemma Mojica, and Emily Thrasher present a framework for investigating “big” data sets starting as early as middle school in "Digging Into Data: Illustrating a Data Investigation Process." While … [Read more...] about Editor’s Note: Spring 2022
Archives for March 2022
Announcements: Spring 2022

Submit Lesson Plans, Articles, and Announcements to Statistics Teacher Please consider submitting some of your K–12 statistics lesson plans for publication or writing and sharing an article. We also accept announcement submissions. For more information, see the ST submission guidelines or contact the ST editors. Upcoming Deadlines ASA Data Visualization Poster … [Read more...] about Announcements: Spring 2022
Digging into Data: Illustrating a Data Investigation Process
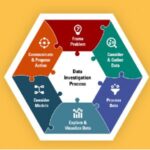
By Hollylynne S. Lee, Gemma F. Mojica, Emily Thrasher, NC State University, Friday Institute for Educational Innovation Many argue K–12 students need to urgently develop a practice of using data in investigations of real-world phenomena through processes that will prepare them to be data-literate citizens and open doors for data-intensive career pathways. Statistics and data … [Read more...] about Digging into Data: Illustrating a Data Investigation Process
Using 2020 Census Data in Your Classroom
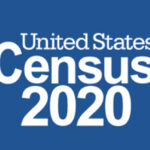
By Jessica Palmer, US Census Bureau Did you know the population of the United States on April 1, 2020, was 331,449,281—an increase of 22,703,743—or 7.4 percent—from 2010? Or that California was the most populous state, with 39,538,223 residents, and Wyoming was the least populous, with 576,851 residents? Fun facts like these are great conversational facts to share with … [Read more...] about Using 2020 Census Data in Your Classroom
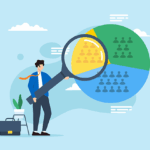
Revealing the Power of Data Visualizations in Social Studies Through Slow Reveal Graphs

By Kristen Taurence, Tamara Shreiner, and Bradford Dykes, Grand Valley State University Data visualizations cut across many disciplines and, as stated in the GAISE Pre-K–12 Report, more disciplines are incorporating statistical reasoning within their standards. In fact, data visualizations are ubiquitous in social studies education. Social studies textbooks and online … [Read more...] about Revealing the Power of Data Visualizations in Social Studies Through Slow Reveal Graphs
Lesson Plan: Investigation of a Claim Using Technology

Does a can of mixed nuts contain approximately 50 percent peanuts? In Investigation 16 from Focus on Statistics: Investigations for the Integration of Statistics into Grades 9-12 Mathematics Classrooms by Sara Brown, Patrick Hopfensperger, and Henry Kranendonk, students are introduced to the concept of informal statistical inference and focus on an investigation about … [Read more...] about Lesson Plan: Investigation of a Claim Using Technology
Lesson Plan: Investigation of Categorical Data from a Survey
Are you looking for a lesson plan that incorporates the four components of statistical problemsolving with a focus on categorical data? An important distinction for students to understand and implement in a statistical study is how the analysis of numerical data is different from categorical data. Investigation 9 from Focus on Statistics: Investigations for the Integration … [Read more...] about Lesson Plan: Investigation of Categorical Data from a Survey