
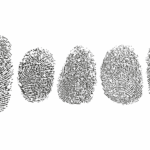
By Megan Mocko, University of Florida, and Katina Gothard, Eastern Florida State College Overview of Lesson In this activity, we will explore the population distribution and sample distribution of fingerprints with loops. Students will also explore how the sample proportion of fingerprints with loops varies from sample to sample. After collecting many sample proportions, … [Read more...] about Lesson Plan: Exploring the Sampling Distribution of the Sample Proportion with a Study of Fingerprint Types in the US
Lesson Plans
Lesson Plan: If You Only Have One Hour … Teaching Statistical Inference to Youth

By Beth Chance, Elsa Medina, and Jacquelyn Silverbush, Cal Poly, San Luis Obispo Statistical inference is the science of drawing conclusions beyond observed sample data to a larger population or process. In a college statistics course, students learn about probability, confidence intervals, and p-values and apply these ideas to research studies. The article “Assessment of … [Read more...] about Lesson Plan: If You Only Have One Hour … Teaching Statistical Inference to Youth
Lesson Plan: Exploring Whether a Difference Is a Meaningful Difference

By Tim Jacobbe, Southern Methodist University; Chris Franklin, University of Georgia; Gary Kader, Appalachian State University; and Kaycie Maddox, Northeast Georgia Regional Educational Service Agency Overview of Lesson This investigation focuses on students conducting a comparative experiment to explore whether there are meaningful differences between the number of times … [Read more...] about Lesson Plan: Exploring Whether a Difference Is a Meaningful Difference
Lesson Plan: Exploring Fundamental Definitions with a Study of Fingerprint Types in the US
In this lesson by Katina Gothard and Megan Mocko, students will randomly sample beads out of a bin to simulate random samples of people’s fingerprints. Students will see that the sample proportion of fingerprints with arches (one of the three common fingerprint patterns) varies from sample to sample. The purpose is to guide students in the development of, and identify any … [Read more...] about Lesson Plan: Exploring Fundamental Definitions with a Study of Fingerprint Types in the US
Lesson Plan: Investigation of a Claim Using Technology
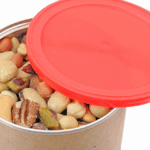
Does a can of mixed nuts contain approximately 50 percent peanuts? In Investigation 16 from Focus on Statistics: Investigations for the Integration of Statistics into Grades 9-12 Mathematics Classrooms by Sara Brown, Patrick Hopfensperger, and Henry Kranendonk, students are introduced to the concept of informal statistical inference and focus on an investigation about … [Read more...] about Lesson Plan: Investigation of a Claim Using Technology
Lesson Plan: Investigation of Categorical Data from a Survey

Are you looking for a lesson plan that incorporates the four components of statistical problemsolving with a focus on categorical data? An important distinction for students to understand and implement in a statistical study is how the analysis of numerical data is different from categorical data. Investigation 9 from Focus on Statistics: Investigations for the Integration … [Read more...] about Lesson Plan: Investigation of Categorical Data from a Survey
Lesson Plan: Using Photographs as Data Sources to Tell Stories About Our Favorite Outdoor Spaces

Pip Arnold, Sheri Johnson, and Leticia Perez all started with the same initial prompt: Use photographs as data. The result? Three lesson plans that show it is possible to take an idea and develop it to best suit the interests of your students and you. All three lessons are aimed at the grades 6–9. You may like to work with one lesson plan or pick elements of all three to use … [Read more...] about Lesson Plan: Using Photographs as Data Sources to Tell Stories About Our Favorite Outdoor Spaces
Lesson Plan: Nonlinear Modeling: Something Fishy

In this lesson by Douglas Whitaker, students explore nonlinear regression models to explain fish weight by using fish length. They will use both transformation of the response variable and polynomial regression. Geometric interpretations of variables are leveraged to suggest nonlinear models to fit. The intention of this lesson is for students to perform two or three linear … [Read more...] about Lesson Plan: Nonlinear Modeling: Something Fishy
Lesson Plan: How Long Are the Words in the Gettysburg Address?

In this lesson by Gary Kader, Christine Franklin, Tim Jacobbe, and Kaycie Maddox, each student tries two methods for selecting a sample from the population of words in the Gettysburg Address: self-selection and simple random sampling. Then, as a class, students construct dotplots and calculate numerical summaries to show how sample means vary from sample to sample. Using … [Read more...] about Lesson Plan: How Long Are the Words in the Gettysburg Address?
Lesson Plan: The Mean and Variability from the Mean
The Pre-K-12 GAISE report emphasizes that students should be able to do more than just calculate summary statistics; they need conceptual understanding of those statistics that deepens as they progress through different levels of statistical literacy (Levels A, B, and C). The purpose of this activity is to develop students’ conceptual understanding of numerical summaries used … [Read more...] about Lesson Plan: The Mean and Variability from the Mean