
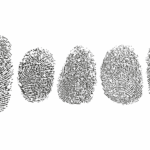
In this lesson by Katina Gothard and Megan Mocko, students will randomly sample beads out of a bin to simulate random samples of people’s fingerprints. Students will see that the sample proportion of fingerprints with arches (one of the three common fingerprint patterns) varies from sample to sample. The purpose is to guide students in the development of, and identify any … [Read more...] about Lesson Plan: Exploring Fundamental Definitions with a Study of Fingerprint Types in the US
9-12+
Experiments of Two Identical Coin Tosses

By Biserka Kolarec Students often learn a classical definition of probability early in the process of developing statistical literacy. That definition states that if there are equal odds of all experiment outcomes or events, the probability of a specific event equals the number of favorable outcomes divided by the number of all possible outcomes. The simplest example of a … [Read more...] about Experiments of Two Identical Coin Tosses
Predicting Election Results from Football Statistics (1936–2020): An Archival Analysis in a Real-World Example

By Kenneth M. Cramer, Rebecca Pschibul, and Alexander J. Cramer Scientists are in the business of predicting events (like failed picnics from rain showers) based on empirically salient factors or antecedents (like barometric pressure and wind speed). This business rests on the assumption of determinism—that our universe is knowable with properties that can be measured and … [Read more...] about Predicting Election Results from Football Statistics (1936–2020): An Archival Analysis in a Real-World Example
Using 2020 Census Data in Your Classroom
By Jessica Palmer, US Census Bureau Did you know the population of the United States on April 1, 2020, was 331,449,281—an increase of 22,703,743—or 7.4 percent—from 2010? Or that California was the most populous state, with 39,538,223 residents, and Wyoming was the least populous, with 576,851 residents? Fun facts like these are great conversational facts to share with … [Read more...] about Using 2020 Census Data in Your Classroom
Revealing the Power of Data Visualizations in Social Studies Through Slow Reveal Graphs

By Kristen Taurence, Tamara Shreiner, and Bradford Dykes, Grand Valley State University Data visualizations cut across many disciplines and, as stated in the GAISE Pre-K–12 Report, more disciplines are incorporating statistical reasoning within their standards. In fact, data visualizations are ubiquitous in social studies education. Social studies textbooks and online … [Read more...] about Revealing the Power of Data Visualizations in Social Studies Through Slow Reveal Graphs
Lesson Plan: Investigation of a Claim Using Technology
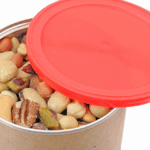
Does a can of mixed nuts contain approximately 50 percent peanuts? In Investigation 16 from Focus on Statistics: Investigations for the Integration of Statistics into Grades 9-12 Mathematics Classrooms by Sara Brown, Patrick Hopfensperger, and Henry Kranendonk, students are introduced to the concept of informal statistical inference and focus on an investigation about … [Read more...] about Lesson Plan: Investigation of a Claim Using Technology
Lesson Plan: Investigation of Categorical Data from a Survey
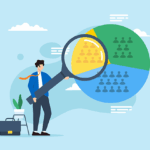
Are you looking for a lesson plan that incorporates the four components of statistical problemsolving with a focus on categorical data? An important distinction for students to understand and implement in a statistical study is how the analysis of numerical data is different from categorical data. Investigation 9 from Focus on Statistics: Investigations for the Integration … [Read more...] about Lesson Plan: Investigation of Categorical Data from a Survey
Lesson Plan: Using Photographs as Data Sources to Tell Stories About Our Favorite Outdoor Spaces

Pip Arnold, Sheri Johnson, and Leticia Perez all started with the same initial prompt: Use photographs as data. The result? Three lesson plans that show it is possible to take an idea and develop it to best suit the interests of your students and you. All three lessons are aimed at the grades 6–9. You may like to work with one lesson plan or pick elements of all three to use … [Read more...] about Lesson Plan: Using Photographs as Data Sources to Tell Stories About Our Favorite Outdoor Spaces
Developing the Theory of Hypothesis Testing: An Exploration

By Craig Lazarski, Cary Academy There are many concepts associated with hypothesis testing, but it all comes down to variation. How unusual is the variation we observe in a sample? Students can often lose sight of this basic idea once they have learned the various procedures introduced in an introductory statistics course. Further, they may blindly follow the procedure … [Read more...] about Developing the Theory of Hypothesis Testing: An Exploration
Skew The Script: A Website Offering Socially Relevant Math Lessons

By Dashiell Young-Saver “You can take those candies and shove them up your …” These were the last words Michael spoke to me before leaving class and leaving high school—permanently. We were using candy to simulate sampling methods. It was my first year teaching high-school statistics and I was proud of myself for creating an interactive activity, rather than a boring … [Read more...] about Skew The Script: A Website Offering Socially Relevant Math Lessons