By Leticia Perez, Cynthia McIntyre, and Frieda Reichsman As data become increasingly central to science, mathematics, and everyday decision-making, teachers need accessible ways to integrate authentic datasets into classroom instruction. Although vast public data repositories exist, locating, cleaning, and contextualizing real-world data remains a significant barrier for … [Read more...] about Data Biographies: A Tool for Integrating Real-World Data into Classrooms
6-8
Lesson Plan: Vietnam War Draft Probability Exploration
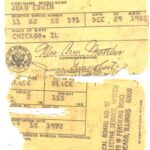
Overview of Lesson In this lesson, students explore actual data from the 1969 Vietnam War Draft, which was used as a way for the Selective Service to prove to the United States public that the draft was a truly random way to choose who would be chosen to serve. But how truly random was it? In this investigation, students will simulate the way that men were chosen to be … [Read more...] about Lesson Plan: Vietnam War Draft Probability Exploration
Integrating Data Science Practices into Informal Learning: A STEM Summer Camp Approach
By Marc T. Sager, Southern Methodist University; Saki Milton, Southern Methodist University; Candace Walkington, Southern Methodist University; and Anthony J. Petrosino, Southern Methodist University For teachers and practitioners, this paper offers a model for integrating accessible, equity-minded data science activities into informal learning programs. Readers will gain … [Read more...] about Integrating Data Science Practices into Informal Learning: A STEM Summer Camp Approach
Some Paradoxes: Puzzling or Poorly Presented?
By Mark Milanick, University of Missouri, Columbia; Isabella Wiebelt-Smith, Swarthmore College; and William Y. Jin, Swarthmore College This article explores the use of statistical paradoxes—specifically the Will Rogers Phenomenon, Simpson’s Paradox, False Positive Paradox, and the Birthday Problem—as teaching tools for middle and high school students. These paradoxes, often … [Read more...] about Some Paradoxes: Puzzling or Poorly Presented?
ASA/NCTM Joint Committee Members Share Favorite Resources, Ideas
Data-Driven Minds: Prepping Students for a Smarter Future How can teachers design data-centered classrooms to empower their students? What strategies and tools can help increase data literacy and data science in K–12 education? How do teachers bring a focus to data-centered instruction in their math classrooms? How can data science be related to music and cooking? These … [Read more...] about ASA/NCTM Joint Committee Members Share Favorite Resources, Ideas
Lesson Plan: Sticky Note Statistics
By Joanne Caniglia, Kent State University Overview of Lesson This set of activities allows students to analyze data from graphs created with sticky notes. Students are asked to estimate a string’s length. Their estimates are put on sticky notes, forming dot and box plots. Following initial estimates and graphs, more estimation exercises are given to students (with strings … [Read more...] about Lesson Plan: Sticky Note Statistics
Making Sense of Data Visualizations: A Toolkit for Supporting Student Discussions
By Emily Thrasher, Hollylynne Lee, Bruce Graham, Matthew Grossman, Gemma Mojica, NC State University This paper explores a comprehensive framework to develop students’ data literacy by guiding them in making sense of complex data visualizations. With the growing complexity and prevalence of data visualizations in media, it’s crucial to equip students with the skills to … [Read more...] about Making Sense of Data Visualizations: A Toolkit for Supporting Student Discussions
Data Science in Secondary Grades: Exploring Our Communities Through Pictures
By Michelle Dueck, Heritage Christian School; Pedro Gallegos, APEX Academy Charter School; Rosa Pastor, LA Promise Charter Middle School; Alvaro Pineda, East Valley High School; and Anna Bargagliotti, Loyola Marymount University Today, data is more critical than ever. Often, data are collected automatically through devices throughout our daily lives. A big challenge in … [Read more...] about Data Science in Secondary Grades: Exploring Our Communities Through Pictures
A Guided Lesson on Fake News for Improving Statistical Literacy
By Rebecca Pierce, Ball State University, and Matthew Brenneman, Embry Riddle Aeronautical University The goal of the GAISE: Pre-K–12 Report is statistical literacy for all. But statistical literacy is not achievable unless students understand why they personally need to learn statistics. One could cite high-paying jobs in data science as a motivation, but this pertains to … [Read more...] about A Guided Lesson on Fake News for Improving Statistical Literacy
Census Bureau Offers Classroom Resources
By Jessica Palmer, US Census Bureau Did you know the United States exported approximately $60.9 million in pumpkins, squash, and gourds in 2022? Use facts such as this to supplement what you are teaching this fall with the US Census Bureau’s Statistics in Schools program. These resources can help you prepare for the remainder of the year while encouraging statistical … [Read more...] about Census Bureau Offers Classroom Resources


