

By Sean Bradley, Clarke University Anyone who loves math appreciates a good mathematical model. There is no shortage of useful workhorses in statistics–normal, t, F, and chi-square distributions come quickly to mind. Mathematicians and statisticians of yesteryear developed these beautiful models to overcome the inability to use brute force methods to answer statistical … [Read more...] about Model t, or a Newer Randomization?
Archives for March 2018
New Editor Takes Reins of Statistics Teacher

New Statistics Teacher (ST) editor, Jessica Cohen, may be new to the role, but not to the journal. Cohen, a professor at Western Washington University (WWU), is a former associate editor of the Statistics Teacher Network, ST’s PDF predecessor. With the journal’s spring issue, she’ll take over for outgoing editor Angela Walmsley. “Angela has set the stage really nicely,” … [Read more...] about New Editor Takes Reins of Statistics Teacher
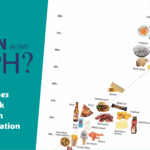
ASA and New York Times Partner to Create ‘What’s Going On in This Graph?’
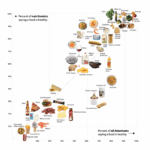
By Sharon Hessney, Donna LaLonde, and Rebecca Nichols In this column, we want to highlight an exciting new partnership between The New York Times Learning Network and the American Statistical Association. Fifteen years ago, The New York Times started the Learning Network—a free, online feature that provides materials to help teachers use the newspaper … [Read more...] about ASA and New York Times Partner to Create ‘What’s Going On in This Graph?’
STATS4STEM.ORG: A Statistical Learning Platform for Educators and Their Students

By Eric J. Simoneau A team funded by the National Science Foundation (NSF) is building STATS4STEM.ORG, a statistics-learning website with cutting-edge data, computing, and statistical learning resources. In this webinar, project lead Eric Simoneau shows the current functionality of the site and shares the timeline for enhancements. The article below, which originally … [Read more...] about STATS4STEM.ORG: A Statistical Learning Platform for Educators and Their Students
Improve Quantitative Literacy with Graphs
Live Discussion Now Weekly on Wednesdays Build quantitative literacy with your middle- and high-school math, science, and humanities students with the free weekly online feature “What’s Going On in This Graph?” Starting on September 12, The New York Times Learning Network—in partnership with the American Statistical Association—will host a live discussion most Wednesdays … [Read more...] about Improve Quantitative Literacy with Graphs
Lesson Plan: How Far Can You Jump?

This investigation was originally published in Bridging the Gap Between Common Core State Standards and Teaching Statistics created by Pat Hopfensperger, Tim Jacobbe, Deborah Lurie, and Jerry Moreno. (Grade 6 – Common Core State Standards: 6.SP.1-5) This investigation focuses on students conducting a comparative experiment to explore the effect a fixed target will have on … [Read more...] about Lesson Plan: How Far Can You Jump?
Announcements: Spring 2018

Upcoming Deadlines Registration for Meeting Within a Meeting (MWM) Statistics Workshop for Middle- & High-School Math and Science Teachers Registration Is Open Meeting Within a Meeting Statistics Workshop for Middle- and High-School Mathematics and Science Teachers will take place in conjunction with the Joint Statistical Meetings, July 28–August 2, in Vancouver, … [Read more...] about Announcements: Spring 2018
Lesson Plan: How Tall Were the Ancestors of Laetoli?

This investigation was originally published in Bridging the Gap Between Common Core State Standards and Teaching Statistics by Pat Hopfensperger, Tim Jacobbe, Deborah Lurie, and Jerry Moreno. (Grade 8 – Common Core State Standard 8.SP.1) The focus of this investigation is to look for and measure the degree of any relationship between two quantitative variables, specifically … [Read more...] about Lesson Plan: How Tall Were the Ancestors of Laetoli?