

By Jessica Palmer, US Census Bureau
Did you know the United States exported approximately $60.9 million in pumpkins, squash, and gourds in 2022? Use facts such as this to supplement what you are teaching this fall with the US Census Bureau’s Statistics in Schools program. These resources can help you prepare for the remainder of the year while encouraging statistical literacy with real-life data. Statistics in Schools has a large offering of materials for K–12 students—from standards-based activities to five-minute challenges to fun facts handouts.
Gear up for fall festivities with their Kahoot! game, Harvests and Hayrides: Fall Fun with Census Data. This quiz tests students’ knowledge of the number of pumpkins and apples the US exports, places in the US with spooky-sounding names, the state projected to raise the most turkeys, and more.
Kahoot! Games
Statistics in Schools has more than 20 Kahoot! games like the following:
- US Census Bureau Data. Test your students on how much they know about the people, places, and economy of the United States, as well as the work of the US Census Bureau.
- Exploring Statistics on America’s Diverse Population. This assortment of games highlights statistics pertaining to holidays, anniversaries, and observances for America’s diverse population.
- Through the Seasons with Census Bureau Data. Put your students’ skills to the test with this assortment of seasonal games.
- Where to Next: Exploring US Careers and Occupations. This collection of games highlights Census Bureau statistics on careers and occupations in the United States such as veterinarians, lawyers, software developers, and police officers.

STEM/STEAM Careers
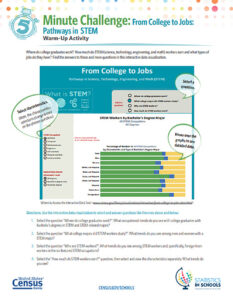
Prepare students with an interest in a STEM/STEAM-related career with the five-minute warm-up challenge called From College to Jobs: Pathways in STEM. This resource has students explore an interactive data visualization that illustrates the relationship between college majors and jobs, with a focus on STEM workers. Then, students look at the characteristics and educational attainment level of STEM-related and non-STEM workers.
Did you know the most common STEM occupation is software developer? The Kahoot! game Where to Next: Exploring STEM Careers is designed to help high-school students learn about STEM careers as they think about their future after high school. Students learn facts such as the number of people in the US working in STEM jobs and the median earnings of people in select STEM professions.
As students think about careers and potential future earnings, Statistics in Schools’ new suite of Kahoot games, Where to Next: Exploring US Careers and Occupations, highlights statistics on a variety of careers and occupations, including the following:
- Where to Next: Exploring Health Care Careers. Health care is one of the fastest‐growing industries. Did you know there were more than 2 million registered nurses in the United States in 2021? Players learn facts such as average salaries of different jobs; the number of US people working as dentists, surgeons, and veterinarians; and industry demographics.
- Where to Next: Exploring Legal and Protective Service Careers. Did you know there were more than 784,000 US police officers in 2021? Or that more than one in three US lawyers were women in 2021? Students play to learn facts such as the number of US residents working as paralegals, judges, and firefighters; the number of investigation services across the country; and average US salaries.
These free activities can be used in all subjects, including math, history/social studies, geography, sociology, and English. Visit the program’s Monthly Highlights page, which gives a glance at materials available for upcoming observances. You can also sign up for their monthly newsletters to learn about new resources and how you can incorporate more real-world data into your classroom lessons.