• Skip to main content
  • Skip to secondary menu
  • Skip to primary sidebar
  • Skip to footer
  • Home
  • About Statistics Teacher
Statistics Teacher

Statistics Teacher

Supporting the Teaching and Learning of Statistics

  • Submissions
  • Articles
    • 9-12+
    • 6-8
    • K-5
  • Announcements
  • Lesson Plans
    • Lesson Plans
    • Lesson Plan Archive
  • Resources
    • Free Webinars
    • Posters
    • Publications
    • Supplemental
  • Events
You are here: Home / 6-8 / Lesson Plan: How Long Are the Words in the Gettysburg Address?

Lesson Plan: How Long Are the Words in the Gettysburg Address?

November 12, 2020

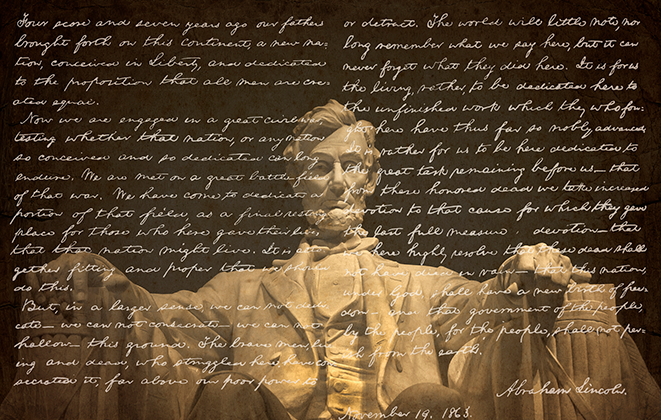
In this lesson by Gary Kader, Christine Franklin, Tim Jacobbe, and Kaycie Maddox, each student tries two methods for selecting a sample from the population of words in the Gettysburg Address: self-selection and simple random sampling. Then, as a class, students construct dotplots and calculate numerical summaries to show how sample means vary from sample to sample.

Using these plots and numerical summaries, students see self-selected samples tend to over-represent the longer words in the Gettysburg Address and produce sample means that are larger than the actual population mean (biased sampling method). On the other hand, simple random samples tend to be representative of the population and produce sample means balanced on both sides of the population mean (unbiased sampling method).

Finally, students explore the relationship between sample size and sample-to-sample variability. Students discover that larger random samples produce sample means with less variability.

Download Lesson Plan (PDF)

Download Worksheet (Word)

Primary Sidebar

EDITORS’ NOTE

a sketch done, in one line, of a hand holding a pen.

Student Competitions

  • ASA Data Visualization Poster Competition
  • Virtual Science Fair
  • ASA Statistics Project Competition

Categories

Archives

Archives (1982-2016)

Most-Often Used Keywords

9-12 announcements AP Statistics ASA awards BAPS Census at School classroom CODAP Common Core data Data collection data science Data Visualization data visualization poster competition education GAISE GAISE II high school inference k-12 education k-12+ lesson plan lesson plans Mathematics and Statistics Awareness Month middle school MWM National Council of Teachers of Mathematics NCTM p-value poster competition probability resources SET statistical literacy statistical reasoning Statistics statistics education STEM STEW technology ThisIsStatistics Virtual Science Fair WGOITG What's Going on in This Graph?

Footer

About

Statistics Teacher (ST) is an online journal published by the American Statistical Association (ASA) – National Council of Teachers of Mathematics (NCTM) Joint Committee on Curriculum in Statistics and Probability for Grades K-12. ST supports the teaching and learning of statistics through education articles, lesson plans, announcements, professional development opportunities, technology, assessment, and classroom resources. Authors should use this form to submit articles or lesson plans.

Contact

Contact the Statistics Teacher editors for further information or to volunteer to write or review content.

Copyright © 2026 · American Statistical Association