
Affective recollections of statistical education among K–12 school counselors
By Anna Yu Lee
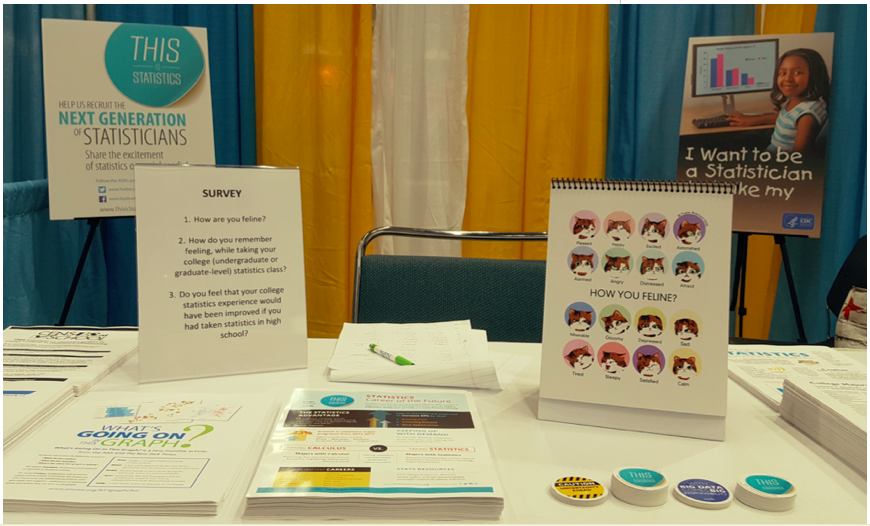
The American Statistical Association hosted a booth at the annual American School Counselor’s Association conference in Los Angeles July 14-17, 2018, to promote the practice and profession of statistics among approximately 3,000 K-12 school counseling professionals.
ASA representatives generated booth traffic and initiated conversations with apparent school counselors (most of whom were identified by their lanyards) by pointing to a feline faces chart and asking, “How are you feline?” Booth visitors who responded to this question were asked about how they remembered feeling during their statistics college classes and whether they thought their experience taking these classes would have been any better if they had received prior statistical education.

Question 1: How do you remember feeling while taking your college (undergraduate- or graduate-level) statistics classes?
Responses were collected by asking participants to look at a feline faces chart—a visual tool with 16 faces of cats wearing various facial expressions and captioned emotions that can be used to communicate about emotions—and point to and state the feelings they felt most accurately represented their responses to given questions (one emotion per question).
Question 2: Do you feel that your college statistics experience would have been improved if you had taken statistics in high school?
Responses to this question included “yes,” “probably,” “maybe,” “probably not,” “no,” and “other.”
Responses to the questions are described in Figure 1 and Table 1.
Counselors who remained at the booth were provided with information about the rising importance of statistics as a career option, a list of undergraduate and graduate majors requiring coursework in statistics, a list of career fields available to students with statistical education/training, and an offer for follow-up visits and consultations with ASA representatives who could work with each school or program to meet their specific needs.
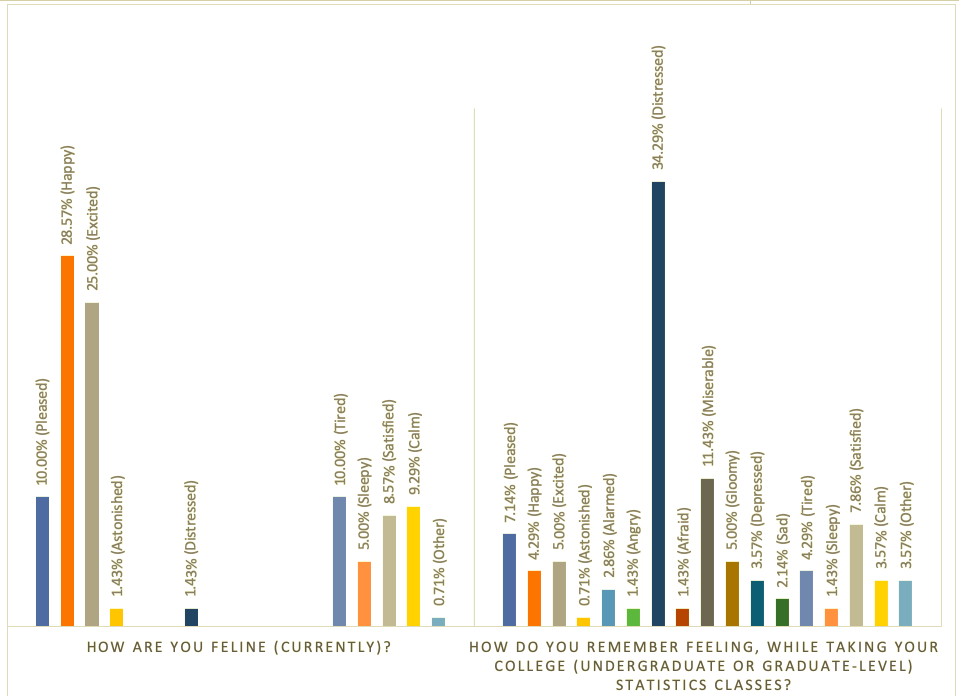
Figure 1. Current emotions versus recalled emotive experiences of studying statistics in undergraduate or graduate classes among 140 school counselors
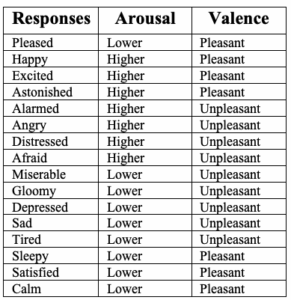
Table 1. Categorization Emotion Options Presented to Participants
Responses indicated the majority of school counselors recalled experiences they described with words associated with more unpleasant affect (i.e., alarm, anger, distress, fear, misery, gloom, depression, sadness, and tiredness; n = 93; 66 percent). By contrast, a majority of counselors reported same-day (i.e., current) emotions associated with more pleasant affect (i.e., pleasure, happiness, excitement, astonishment, sleepiness, satisfaction, and calm; n = 123; 88 percent).
Both recalled emotive experiences and current emotional states appeared approximately balanced on dimensions of arousal: recalled experiences associated with lower arousal (i.e., pleasure, misery, gloom, depression, sadness, tiredness, sleepiness, satisfaction, and calm, n = 65, 46 percent); recalled experiences associated with higher arousal (i.e., happiness, excitement, astonishment, alarm, anger, distress, fear, n = 70, 50 percent); current emotions associated with lower arousal (n = 60, 43 percent); current experiences associated with higher arousal (n = 79, 56 percent).
A majority of counselors indicated they thought having taken statistics in high school would have improved their experiences with taking college statistics by answering “yes” to Question 2 (n = 76; 54 percent).
This experience provided evidence for the following:
- A preponderance of negative personal memories associated with studying statistics in college among school counselors
- Perceived benefits of prior K-12 statistical education on subsequent undergraduate- and graduate-level statistics studies among school counselors
- Potential benefits of including the feline faces chart in participant recruitment and data-collection efforts
The responses of the participants in this study were informative, as they contextualized and provided insight into the emotions and perspectives of school counselors-a group particularly positioned for shaping the content and direction of early education curricula.