
Developing authentic formative and summative assessments is challenging, so this column will focus on suggestions for lesson-specific assessments to overarching frameworks. The Guidelines for Assessment and Instruction in Statistics Education (GAISE) Report: A Pre-K–12 Curriculum Framework, published in 2007, remains an important resource for developing authentic … [Read more...] about Developing Authentic Assessments
Archives for February 2017
Technology Insights
By Rebecca Nichols and Donna LaLonde One of the Standards for Mathematical Practice calls on students to “Use appropriate tools strategically.” In part, this practice viewed through a statistical lens is described in the Statistical Education of Teachers (SET) report as, “Statistically proficient students at various grade levels are able to use technological tools to carry … [Read more...] about Technology Insights
Where’s Wenda? An Activity on Teaching Middle-School Students Data Privacy

By Claire M. Bowen and Evercita C. Eugenio When middle school students hear the word science, many imagine looking at bacteria under a microscope or mixing chemicals over a Bunsen burner, not writing mathematical equations or typing code on a computer. At the University of Notre Dame, 230–280 middle-school girls (6th through 8th grade) attend Expanding Your Horizons (EYH), … [Read more...] about Where’s Wenda? An Activity on Teaching Middle-School Students Data Privacy
When Losing Is Winning: An Exploratory Analysis of Data from The Biggest Loser

By Mary Richardson and Daniel Adrian Students should be exposed to current and interesting data sets. Most, if not all, will have at least some familiarity with The Biggest Loser television show. Portions of the following discussion have been adapted from Wikipedia, visited on July 2, 2016. The Biggest Loser is an American reality TV show that debuted on NBC on … [Read more...] about When Losing Is Winning: An Exploratory Analysis of Data from The Biggest Loser
Sharing a Birthday: Technology-Supported Investigations in Middle School

By Dusty Jones My daughters Rosalie and Lucy share a birthday, but they are not twins. Rosalie is two years older than Lucy. Most people find this surprising, but my uncle Bruce and his son Jesse also share a birthday. Actually, according to Facebook, I have a few friends who share my birthday. Although it is clearly possible for two people to share a birthday, our … [Read more...] about Sharing a Birthday: Technology-Supported Investigations in Middle School
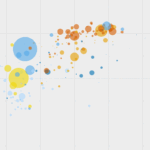
Lesson Plan: EllipSeeIt—Visualizing Strength and Direction of Correlation

By Miguel Olvera and Rafael Diaz (Grades 6–12+) Originally published in February 2017, this lesson focuses on correlation as a way of measuring the strength and direction of a linear association between two numerical variables. After reviewing concepts of bivariate data sets, their graphical representations through scatterplots, and the meaning of a linear association, … [Read more...] about Lesson Plan: EllipSeeIt—Visualizing Strength and Direction of Correlation