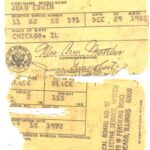
Overview of Lesson In this lesson, students explore actual data from the 1969 Vietnam War Draft, which was used as a way for the Selective Service to prove to the United States public that the draft was a truly random way to choose who would be chosen to serve. But how truly random was it? In this investigation, students will simulate the way that men were chosen to be … [Read more...] about Lesson Plan: Vietnam War Draft Probability Exploration
Lesson Plans
Lesson Plan: Sticky Note Statistics
By Joanne Caniglia, Kent State University Overview of Lesson This set of activities allows students to analyze data from graphs created with sticky notes. Students are asked to estimate a string’s length. Their estimates are put on sticky notes, forming dot and box plots. Following initial estimates and graphs, more estimation exercises are given to students (with strings … [Read more...] about Lesson Plan: Sticky Note Statistics
Lesson Plan: Educational Level Implications on Careers in Statistics (ELICS) for Undergraduate Students
By Christina M. Wood-Wentz, Mayo Clinic, and Heather Cook, University of Southern Indiana Overview of Lesson This career survey course activity is designed to expose undergraduate students to the implications for education level choice and help them plot an educational course that aligns with their work goals. After performing this activity, students will understand how … [Read more...] about Lesson Plan: Educational Level Implications on Careers in Statistics (ELICS) for Undergraduate Students
Lesson Plan: Lizards Task Levels B and C: Teacher Version with Student Version
By Kaycie Maddox and Christine Franklin Overview of Lesson This lesson provides a secondary data set for students to explore to develop understanding of classification, a data science concept, using accessible technology called CODAP. Students will also answer statistical questions used at each of the four phases of the framework for statistical reasoning outlined in … [Read more...] about Lesson Plan: Lizards Task Levels B and C: Teacher Version with Student Version
Lesson Plan: Lizards Task Level A: Teacher Version with Student Version
By Kaycie Maddox and Christine Franklin Overview of Lesson This lesson provides nontraditional data for students to explore with an emphasis on statistical questions used at each of the four phases of the framework for statistical reasoning outlined in the Guidelines for Assessment in Statistics Education (GAISE) II. The use of secondary data on the habitats of … [Read more...] about Lesson Plan: Lizards Task Level A: Teacher Version with Student Version
Lesson Plan: Human vs. Machine: Unveiling Randomness with Data Visualization and Stats
By Venessa N. Singhroy and Rommel Robertson, Queensborough Community College Overview of Lesson Students will learn about the concept of randomness and see how human decision-making contrasts with computer-generated choices. They will also explore the law of large numbers through graphs and be exposed to the Chi Square Goodness-of-Fit test. This lesson also incorporates … [Read more...] about Lesson Plan: Human vs. Machine: Unveiling Randomness with Data Visualization and Stats
Lesson Plan: Association Between Gender and Sport Watching Preference?
By Courtney Rubio, Barrow Arts and Sciences Academy Overview of Lesson Is there an association between gender and the sports students prefer to watch? This activity allows students to analyze data provided in a two-way table using one or more of the following methods: a chi-square test of independence, relative frequencies, segmented bar graph, mosaic plot, or bar chart. … [Read more...] about Lesson Plan: Association Between Gender and Sport Watching Preference?
Lesson Plan: Screen Time and Notifications
By Holly Davis, Kennesaw State University Overview of Lesson Is screen time beneficial or harmful? In this lesson, students will learn how to collect data on the hours they spend on their smartphones and represent it visually. They will also explore a correlation analysis between the two quantitative variables of hours of screen time and number of notifications. This is … [Read more...] about Lesson Plan: Screen Time and Notifications
Lesson Plan: Do Rewards Boost Creativity?
By Alyssa Noland, Chattahoochee High School and Kennesaw State University Overview of Lesson Do rewards boost creativity? This lesson allows students to explore whether intrinsic (self-motivation) or extrinsic (physical) rewards are a better motivator for best results on a creativity assessment. Research studies have shown creativity is best motivated by oneself through … [Read more...] about Lesson Plan: Do Rewards Boost Creativity?
Lesson Plan: Bayesian Inference for Proportion of Water on Earth
By Jason Cleveland, Jacksonville State University Overview of Lesson In this lesson, students will practice data collection through simulation, performing estimation, and providing support for or against a claim. The focus will be on what proportion of Earth is covered by water. To accomplish this, students will employ a simple technique for binary data and use web apps … [Read more...] about Lesson Plan: Bayesian Inference for Proportion of Water on Earth


