

By Angela Walmsley, Mine Dogucu, Susan A. Peters, and Hollylynne Lee
Preparing Pre-K–12 Teachers to Teach Statistics
I often hear high school teachers tell me they never took a statistics class while earning their undergraduate degree. When they are approached by their high school principal to teach a statistics class, they sometimes aren’t sure where to start. I hear the same from elementary and middle school teachers, who ask, “How do I know I can teach statistics effectively when I’m teaching myself some of this curriculum?”
Statistics Teacher can direct teachers to many free resources, but the question remains: What do we need to do to help teachers at all levels to teach statistics?
The ASA-NCTM Joint Committee developed a position statement on this topic. The recommendations include expanding data literacy in preparation. Suggestions are for university faculty teaching statistics to be familiar with K–12 statistical teaching pedagogy and for education faculty and statistics faculty to work together [read or review Pre-K–12 Guidelines for Assessment and Instruction in Statistics Education II (GAISE II)].
The most effective and quickest way to improve the quality of statistical teaching is to offer professional development to teachers of all levels. Districts and building administrators can promote (and provide the opportunity for) teachers attending professional development. At the National Council of Teachers of Mathematics annual meeting, there have been many statistics education–related sessions available. Statistical Education of Teachers is also a resource.
The ASA and ASA-NCTM Joint Committee also support two summer programs. Stats&DataNet (formally Meeting Within a Meeting) offers free virtual professional learning for K–12 teachers—a full day in late July and then several sessions throughout the year. Beyond AP Statistics targets AP Statistics teachers.
Penguins in the Classroom: An Example Data Set
Use of real-world examples in the statistics classroom can be engaging for students. Use of a variety of examples can show the relevance of statistics in different fields—from business to the sciences. One example is the Palmer Penguins data set, which can bring ecological research to the classroom. The data was originally published in “Ecological Sexual Dimorphism and Environmental Variability Within a Community of Antarctic Penguins” by Kristen Gorman, Tony Williams, and William Fraser in 2014 and then released in an R package by Allison Horst, Alison Hill, and Kristen Gorman in 2020. As of 2025, it was built into the latest version of R.
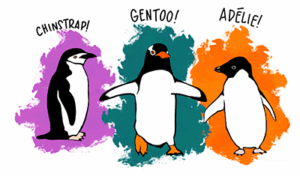
The data set includes variables for three species of penguins (Chinstrap, Gentoo, and Adelie) on three islands in Palmer Archipelago, Antarctica (Biscoe, Dream, or Torgersen).
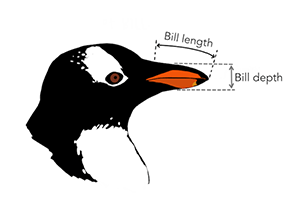
The variables include bill length, bill depth, body mass, sex, species of the penguins, and the island and year the data was collected.
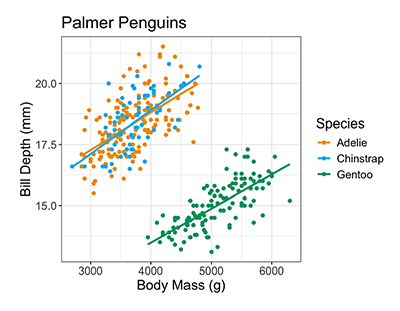
The variables are both categorical (e.g., species, island) and numeric (e.g., body mass). This allows students to make group comparisons. Having multiple numeric variables and categorical variables also allows for multivariable thinking.
For instance, in the Palmer Penguins visualization, two numeric variables and a categorical variable are displayed. Students can talk about body mass of penguins, how body mass differs for different species of penguins, the relationship between body mass and bill depth, and how the relationship between body mass and bill depth differs (or does not differ) for each species.
Authentic Data for Teaching Statistics and Data Science: Easy Access in CODAP
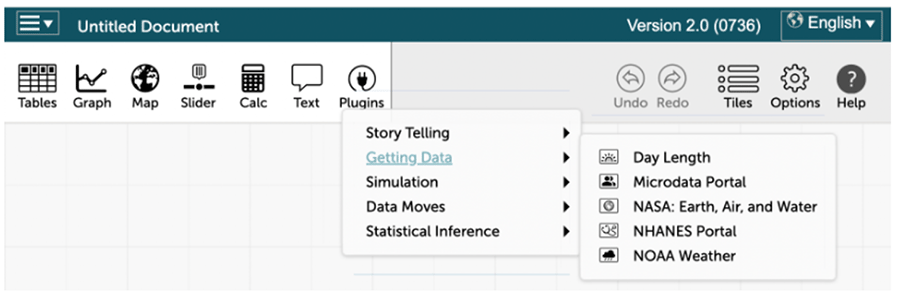
The Common Online Data Analysis Platform is a freely available resource for analyzing data and accessing real data. From within CODAP, users can access several plugins for downloading sample data from the United States Census, National Health and Nutrition Examination Study, National Aeronautics and Space Administration, and more. These data sources can be accessed through the Getting Data menu in the plugins.
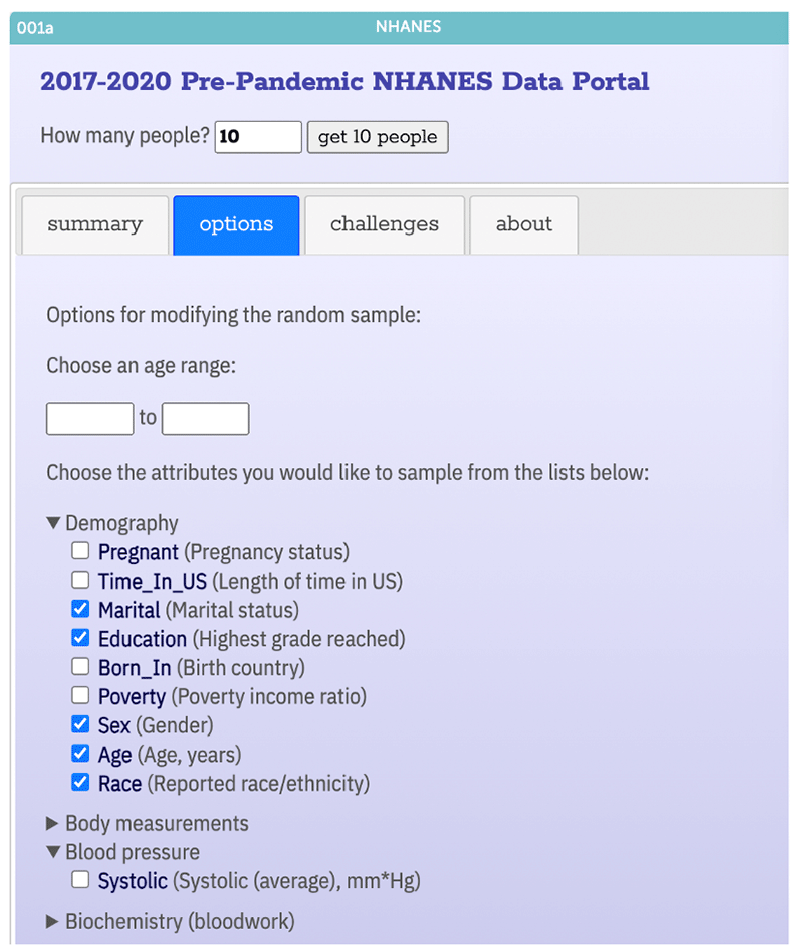
Access to this data through CODAP is simplified from the process for accessing the data through the original sources. Users can select the number of variables (attributes) to collect, and the samples can be of manageable size. For the NHANES portal, for example, the default setting within the portal yields data for a random sample of 10 people for the variables of marital status, education, sex, age, race, weight, height, and body mass index. Users have the option of selecting additional variables and changing the sample size to allow flexibility and select variables of interest to students.
Data automatically appears in a table within CODAP, ready for analysis. In the image below are a sample of 200 people aged 13–15 with six variables. If you don’t want to use CODAP for analyzing the data, you can export the data as a .csv file and then import it into whatever tool you use.

Because the data is real, the samples often do not include values for each variable and thus offer the opportunity to open a conversation about realistic difficulties with collecting data. The next time you are looking for data in which students can see themselves or explore information about their part of the world, consider checking out the data portal plugins within CODAP.