Graphing with Kids: Teaching the Superpower of Numbers and Data

Cole Nussbaumer Knaflic
Imagine a world in which numbers and data come alive to solve problems, spark curiosity, and tell captivating stories. In this world, math isn’t boring or intimidating—it’s vibrant and full of possibilities, unlocking colorful and creative ways to understand the world around us.
This is the world of Daphne, the data-drawing dragon. Daphne thrives on transforming everyday questions into exciting adventures, using graphs and data to uncover answers and share discoveries. She shows kids that mathematics and statistics don’t have to be hard—they can be fun, creative, and meaningful superpowers that connect to everyday life.
Looking for More?
Visit the book’s website, where you can find video companions to the book, interactive activities, and ideas to extend the learning experience.
Explore Daphne’s YouTube channel for videos to enhance lesson plans or use for sub plans.
The Educator Guide contains full lesson plans and discussion questions for grades K–4 that align to both English and math Common Core Standards.
Learn about the process of creating Daphne Draws Data and the inspiration behind the book, along with resources.
View a glossary of terms such as bar chart and scatterplot.
Join the Data Detectives program to receive a ready-to-use toolkit that makes it easy to lead a graphing with Daphne experience with students.
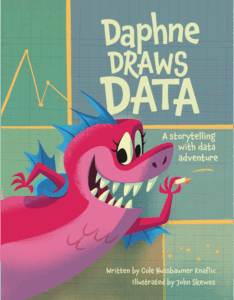
Through Daphne Draws Data: A Storytelling with Data Adventure, Daphne brings her vibrant world to children, inspiring them to explore, create, and make decisions with confidence. Drawing and interpreting graphs become tools of discovery, encouraging curiosity while making math approachable and enjoyable.
In classrooms across the country, elementary teachers are discovering how Daphne’s adventures can spark meaningful learning and joyful exploration of math. One third-grade teacher in Wisconsin begins her data unit by reading Daphne Draws Data aloud to the class, allowing students to see the four types of graphs Daphne creates on her adventures: bar charts; scatterplots; line graphs; and pie charts.
After the read-aloud, the teacher poses a class question inspired by Daphne: “How do we pick books in our classroom library?” Students brainstorm a list—maybe they pick books by the cover, author, or topic, or perhaps because a friend recommended them. The teacher then guides the class through collecting data: Students vote on their favorite way to pick a book anonymously.
The teacher tallies the results and shows the students the survey data. Then, they draw a bar chart together using their data. The teacher then shows students how this same data can be drawn in a pie chart. Students are encouraged to draw their own bar or pie chart as a homework assignment after they design their own survey and collect data from friends and family.
In another classroom in California, a fourth-grade teacher takes it a step further. After graphing their data on book-selection methods, students analyze the results and brainstorm what those insights might mean. One student suggests they make sure their library bins have the front covers facing out if they are going to choose books based on the cover. They redesign a small part of the library accordingly, and a week later, they collect new data to see if their changes helped classmates find books more easily. The teacher said Daphne Draws Data was a hit with her students, opening their eyes to the purposes and possibilities of storytelling with data. The students were also inspired to conduct several graphing activities in class.
Teachers find activities like these go beyond teaching bar graph skills—they empower students to make observations, form questions, analyze data, and act. Whether it’s investigating how much time their class spends on different recess activities, surveying snack preferences, or measuring daily screen time, students begin to see themselves as data collectors and problem-solvers.
Daphne Draws Data supports math standards around data collection, graphing, and analysis and helps students build confidence and agency. The third-grade teacher in Wisconsin noticed students started asking if they could draw a graph like Daphne every day. She even overheard them collecting data on the playground and making their own colorful graphs.
For teachers looking to integrate Daphne’s world into their classroom, the key is to start with a question students care about. Let them collect data, visualize it with color and creativity, and then talk about what they notice. Along the way, students develop fluency in mathematical language, experience the purpose behind bar graphs and charts, and gain a sense of ownership over their learning. Look for free resources and lesson plans on the book’s website. Additionally, to bring graphing to life, join the Data Detectives program to receive a ready-to-use toolkit that makes it easy to lead a graphing with Daphne experience with students.
Download a PDF of this article.
Four-time best-selling author and CEO of Storytelling with Data, Cole Nussbaumer Knaflic helps people and organizations all over the world create graphs that tell compelling stories and influence change.


