STATS4STEM.ORG: A Statistical Learning Platform for Educators and Their Students
Eric J. Simoneau
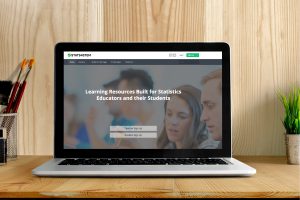
A team funded by the National Science Foundation (NSF) is building STATS4STEM.ORG, a statistics-learning website with cutting-edge data, computing, and statistical learning resources. In this webinar, project lead Eric Simoneau shows the current functionality of the site and shares the timeline for enhancements. The article below, which originally appeared in CHANCE magazine, describes the impetus for the project and the intended uses.
It’s an exciting time to be a statistics educator. Daily, one hears the world has become increasingly awash in data and there is a pressing need for people to be able to use this information to make decisions. Furthermore, as a K–12 statistics educator, I’ve seen AP Statistics enrollment grow over the years to the point where 184,173 students took the AP Statistics exam in 2014.
However, as a teacher who regularly reflects on the curriculum, I often find myself asking if the AP Statistics curriculum we teach nationwide is most appropriate in helping prepare the nation’s students for this ever-increasingly data-centered world. How should current and future high-school students be taught to handle this flood of information?
As I reflect on the thought of 190,000+ AP Statistics students nationwide diligently preparing for this year’s AP Statistics exam with nothing more than a TI-83/84/Inspire calculator (the de facto tools for analyzing data sets in US high schools), I find it hard to be believe we are truly preparing them for the skills required in a big data world.
A strong argument can and should be made for curriculum improvements at the high-school level that help students make sense of the proliferation of complex and rich data. These include data “grappling skills,” visualization, computing, knowledge of statistics, and experience with forecasting and prediction, along with sophisticated communication skills.
Furthermore, one can argue for the importance of repeated experiences in working with data to develop “data habits of mind,” a way of thinking and problem solving with data. Instilling our students with this capacity may help them thrive in an era when statistical analysis is increasingly common and sophisticated. Unfortunately, the US K–12 education system does not currently provide meaningful learning experiences designed to develop understanding of data science concepts or fluency with data science skills.
STATS4STEM.ORG
As schools increasingly become more wired, and laptops/notebooks become increasingly cheaper and more prevalent, there is an opportunity to explore new learning resources and technologies that address previously identified barriers. A team funded by the National Science Foundation (NSF) is rebuilding STATS4STEM.ORG, a statistics-learning website with cutting-edge data, computing, and statistical learning resources. The rebuilt STATS4STEM learning platform is wrapping up its development phase and is scheduled to begin serving students for the 2015–2016 school year and beyond.
The core underlying theory of learning that drives the project is that student learning of data analysis and statistics can be improved if students are allowed to investigate rich, meaningful, and complex problems. Allowing students to work with real data and data analysis tools helps build understanding of the utility of the mathematical concepts they are exploring.
Of course, such exploration requires systematic support, knowledgeable and enthusiastic teachers, and a better understanding of how students think and learn in such rich, complex contexts. The ultimate goal of this project is to provide a robust web-based infrastructure that brings together the following key components, all of which mirror current Guidelines for Assessment and Instruction in Statistics Education (GAISE) K–12 recommendations:
- Meaningful and real-world statistical data sets
- RStudio, a powerful and authentic data analysis tool
- Text and video-based R learning resources
- An embedded assessment and tutoring system
- Teacher training with complementary teacher message board to help support educators
The following is an in-depth look at the project’s main goals:
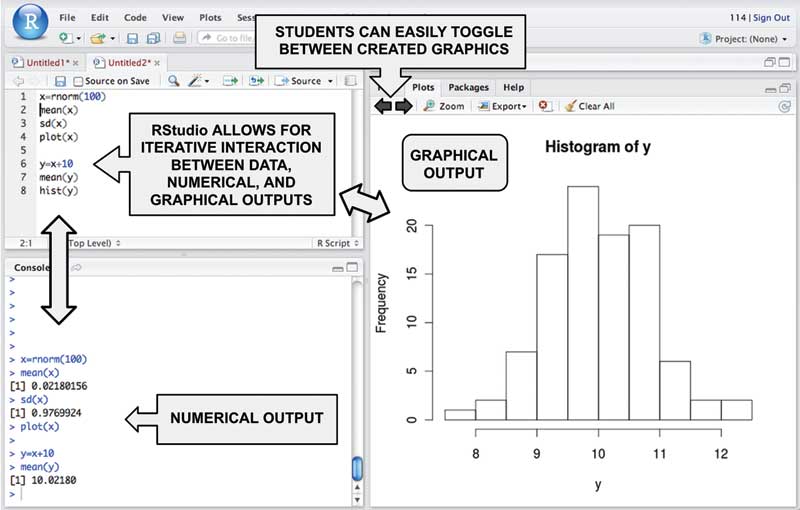
GOAL 1: Provide access to RStudio. Nested within the future STATS4STEM.ORG website is RStudio, a powerful interface that provides a simplified programming environment for students. RStudio presents students with a panel interface that gives them the ability to interact dynamically between R code and both numerical and graphical outputs (see Figure 1).
The AP Statistics course description states that, although the distinction between graphing calculators and computers is becoming blurred as technology advances, the fundamental tool of data analysis at present is the computer.
The computer does more than eliminate the drudgery of hand computation and graphing—it is an essential tool for structured inquiry. Furthermore, high-school statistics educators often struggle to implement basic computing experiences in their courses due to a lack of computational packages. Some educators pay for computing packages such as Fathom, SPSS, or Minitab. However, these resources are often cost-prohibitive for most schools and can only be used on installed computers, severely limiting their educational impact.
Other educators forgo computing activities altogether and use calculators as a replacement. However, this is not ideal, since the AP Statistics course description states that the graphing calculator is a useful computational aid, particularly in analyzing small data sets, but should not be considered equivalent to a computer in teaching statistics.
To help educators infuse computing into their curricula, as suggested by the AP Statistics course description, our project has chosen to use the RStudio web-based computing platform because user interactivity needs only a simple web browser, eliminating the requirement that additional software be installed on the teacher’s or student’s computer.
The RStudio interface, embedded in the STATS4STEM site, provides browser-based access to support any internet-accessible computer lab, library, tablet, notebook (Chromebook), or personal computer. It also offers the same computational power and advanced features as packages such as SPSS or Minitab. This cloud-based learning environment is especially important for students who are economically disadvantaged or for schools that lack up-to-date computers or funding to buy commercial statistical packages.
GOAL 2: Provide educators access to science, technology, engineering, and mathematics (STEM) data sets with complementary data analysis tools. While the idea of having K–12 educators and their students working on accessing and analyzing real-world STEM data holds great promise, two obstacles stand in the way of making this happen on a national scale. The first is the lack of instructional planning time needed on the part of educators to find real-world STEM data sets that can be properly integrated into their curricula. The second is that, even if data sets are obtained, educators often lack an adequate statistical and analytical platform necessary to fully analyze such real-world STEM data sets.
The STATS4STEM.ORG project aims to address both issues. First, the future learning environment will provide educators and their students with a free, web-based version of RStudio. This will be in combination with a web-based repository of STEM data sets that seamlessly integrate with RStudio. This seamless integration between our project’s data sets and RStudio will afford students the opportunity to dynamically interact with data in such a way that is currently impossible using calculators (still the most common method used to analyze data in K–12).
Furthermore, by having authentic experiences in organizing, analyzing, and exploring real-world data, students will have the opportunity to facilitate meaningful statistical learning that can only be achieved by using pedagogically rich data sets with complementary exploratory activities. Second, this environment will serve as a platform to better understand and assess how to integrate authentic data sets, computational tools, and statistical thinking into the existing curriculum.
The project has partnered with Woods Hole Oceanographic Institute, Harvard University’s Institute for Quantitative Social Science, Hubbard Brook Experimental Forest, and researchers from Boston University and Tufts University to create dynamic statistical case studies that draw upon real-world STEM data from diverse research. The case studies expose students to exciting scientific research and prepare them for data-intensive career paths by requiring them to integrate specific domain knowledge with statistical concepts, R programming, and real-world data sets.
GOAL 3: Implement an embedded assessment and tutoring system. To complement RStudio, our project has built and embedded a custom assessment and tutoring system to assess students in statistical and basic R programming concepts, all while simultaneously tutoring students through problem-specific hints and tutorials (see Figure 2).
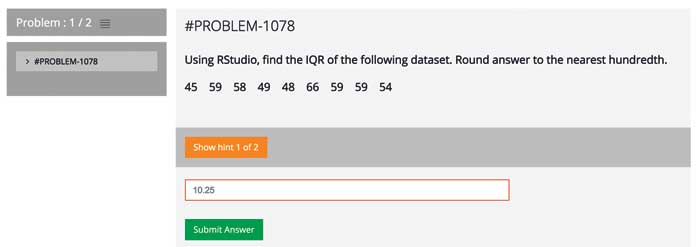
Figure 2. Assessment platform with real-time feedback
By embedding all our learning activities in our assessment and tutoring system, we will enable students to work through learning activities and gain instant feedback, with the option of requesting help in the form of hints if needed (see Figure 3).
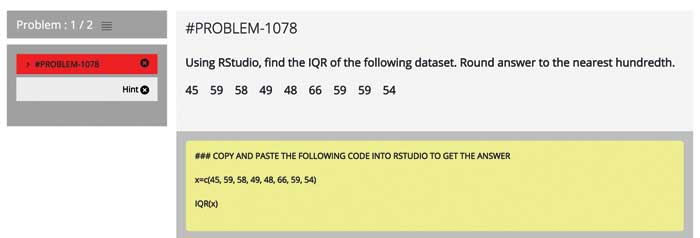
Figure 3. Assessment platform with hints to help students
In addition, teachers will receive a dashboard of student learning data. The dashboard will provide access to student learning data on a student-by-student basis, as well as data on how the class performs as a whole (see Figures 4 and 5). This valuable data can then be used by the teacher to adjust in-class instruction, as needed, and improve student learning. It can also be used by the researchers to improve the tutoring component of the application.
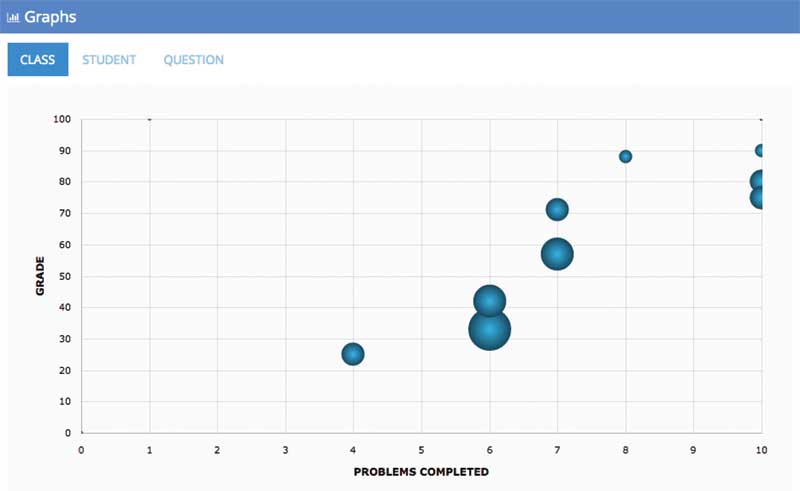
Figure 4. Real-time bubble chart of student learning
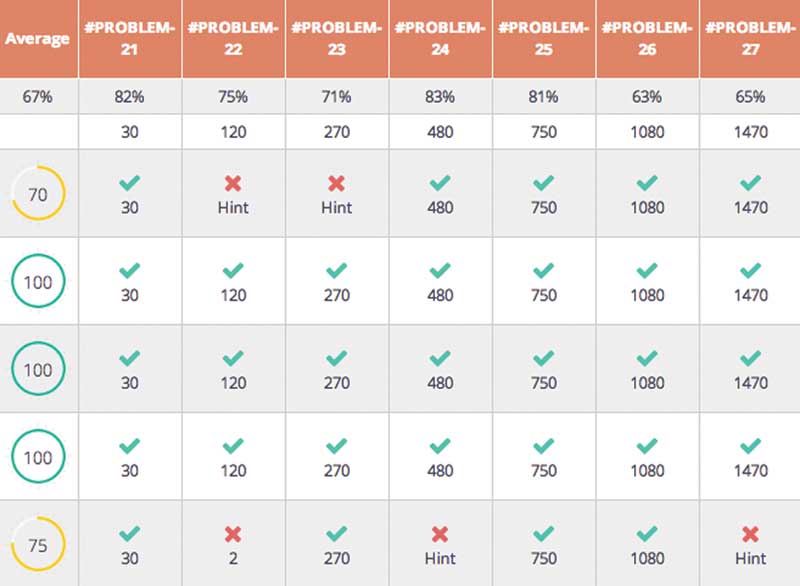
Figure 5. Teacher dashboard
The STATS4STEM Learning Environment
We are developing specific learning resources for the future STATS4STEM.ORG website. Specifically, the website integrates RStudio, STEM data, statistical concepts, and the integrated tutoring and assessment system to facilitate student learning.
R Questions with Embedded Tutoring
To help students conduct basic data analysis using RStudio, our project has created a library of R questions. The questions will come embedded with hints specifically tailored to help struggling students. In addition, students will have the opportunity to use the project’s R tutorials as they work through their R assessment questions. The benefit of this approach is that R skill deficiencies can be identified and corrective action can be taken as needed. If students struggle with R questions, they can use our assessment and tutoring system’s hint feature to gain access to the required code so they do not become stuck. They also will learn the required code to complete the question (see Figure 3).
Assessment and Tutoring-Based Statistical Learning Labs/Activities
These labs and modeling activities (completed in RStudio) reinforce abstract statistical concepts by requiring students to interact dynamically with data and construct simulations in an effort to model random phenomena. Once students learn the basics of R, they will soon begin to treat RStudio as a laboratory environment to support and reinforce the learning of abstract statistical concepts. As a result, students will draw upon their basic R programming skills to analyze data and construct simulations. Such activities allow students the opportunity to gain a deeper understanding of abstract statistical concepts, all while exposing them to the power of computational problem solving.
Assessment and Tutoring-Based Statistical STEM Case Studies
In addition to providing data collected from research undertaken by the project’s institutional partners, the project team is currently developing case studies with corresponding assessments that will help students better understand the context and implications of the ongoing research that the data comes from. The project team is excited by the idea of giving students the opportunity to experience meaningful scientific data collection, analysis, visualization, modeling, and interpretation of real-world data. Equally as exciting, students will have a chance to develop important, cross-cutting concepts and ideas needed to understand important interdisciplinary subjects.
Embedding these case studies in STATS4STEM will give students immediate feedback. In addition, students will have the opportunity to request help in the form of hints if they find themselves struggling with a specific problem, which may be categorized as either statistical or RStudio specific. Finally, teachers will have a dashboard of student learning data to assess student learning on a student-by-student basis, as well as data on how the class performed as a whole. This valuable data can then be used by the teacher to adjust in-class instruction, as needed, to improve overall student learning (see Figures 4 and 5).
Teacher Support Resources
Teacher message board. More than two decades of research have demonstrated the importance of collaboration among teachers. When teachers have the opportunity to discuss with and learn from each other, the quality of their practice and student outcomes improve. The new STATS4STEM website incorporates an embedded discussion forum that will help foster community among our project’s constantly growing group of registered AP Statistics teachers. By providing all teachers with an online forum that fosters discussion in a simple and easy manner, we will give educators the opportunity to learn from each other.
Teacher training. Due to the vast scale of our existing user community, in terms of both number and geographic location, STATS4STEM includes embedded web-based learning modules with the specific purpose of helping educators become proficient in the use of all aspects of the project, including RStudio, and our assessment and tutoring resources.
Expected Teacher Use of Project Resources
As mentioned previously, the STATS4STEM team is in the process of developing and testing a collection of RStudio learning activities to be released early in the new year. Each of these resources is highly modular; all were created using our project’s assessment and tutoring system. Each R-based activity will link to STATS4STEM’s RStudio interface and/or STATS4STEM real-world data sets and case studies. With this collection of modular, web-based activities, the STATS4STEM project will create a collection of 16 learning assignments.
Each assignment is a mixture of R programming activities to introduce students to the prerequisite R programming and computing concepts needed to complete the assignment.
These are followed by a mixture of R programming labs, case studies, and career counseling activities specifically tailored to promote computing. It will be expected that each assignment will take students one to two hours to complete. In addition, this project will ensure that all 16 activities are fully complemented by R tutorials and hints to ensure students can complete each assignment without the aid of their teacher. This is important for promoting wide-scale adoption by teachers and helping dissemination.
To further help promote dissemination, our site will also promote a second timeline for completing the 16 assignments. This second option—one many teachers may find more attractive—would have students complete all 16 assignments concurrently after the AP Statistics exam.
The AP exam takes place at the beginning of May. This option may be an attractive alternative to many high-school teachers, as they often struggle to find activities and content to cover once the AP exam is over. This time period is typically three to four weeks for most high schools; thus, the 16 assignments would provide an ideal solution for teachers looking for new content to cover.
In conclusion, it is our hope and expectation that our project will provide a plethora of new and unique learning resources to the statistics education community. Furthermore, we hope these resources promote and prepare students for the field of statistics and data science nationwide. Stay tuned!
Further Reading
Data Science Class Offers L.A. Unified Students a New Handle on Math.
Programming Tools: Adventures with R
About the Author
Eric J. Simoneau is principal investigator of the STATS4STEM.org development grant, funded by the National Science Foundation, and has been a teacher of both Advanced Placement and regular statistics classes at the Boston Latin School in Boston, Massachusetts, for the last eight years. He holds an MA in mathematical finance from Boston University and MS in statistics from the University of Massachusetts, Amherst. As an educator, he has more than nine years of teaching experience in statistics to high-school and community-college students. In 2009, Simoneau received the Above and Beyond Teaching Award from the Massachusetts Technology Leadership Council for his commitment to STEM education.