Technology Insights
Rebecca Nichols and Donna LaLonde
One of the Standards for Mathematical Practice calls on students to “Use appropriate tools strategically.” In part, this practice viewed through a statistical lens is described in the Statistical Education of Teachers (SET) report as, “Statistically proficient students at various grade levels are able to use technological tools to carry out simulations for exploring and deepening their understanding of statistical and probabilistic concepts.” The landscape of educational technology also includes tools for enhancing our professional practice. In this column we will discuss and describe educational technology to support K–12+ pedagogy and practice.
Our colleagues in New Zealand offer us an incredible tool for data analysis called iNZight. Professor Chris Wild from the Department of Statistics at the University of Auckland leads the project which includes both a desktop version and iNZight Lite, which is an online version. iNZight Lite lets you import your own data set or explore one of the many example data sets; visualize and conduct statistical analysis on the data, and even modify the data, to explore hidden secrets behind the data.”
Both versions have user-friendly interfaces. For example, the desktop iNZight’s quick drag-and-drop interface makes it easy to create graphs of your data. iNZight automatically detects the variable type as either numeric or categorical, and draws a dot plot, scatter plot, or bar chart.
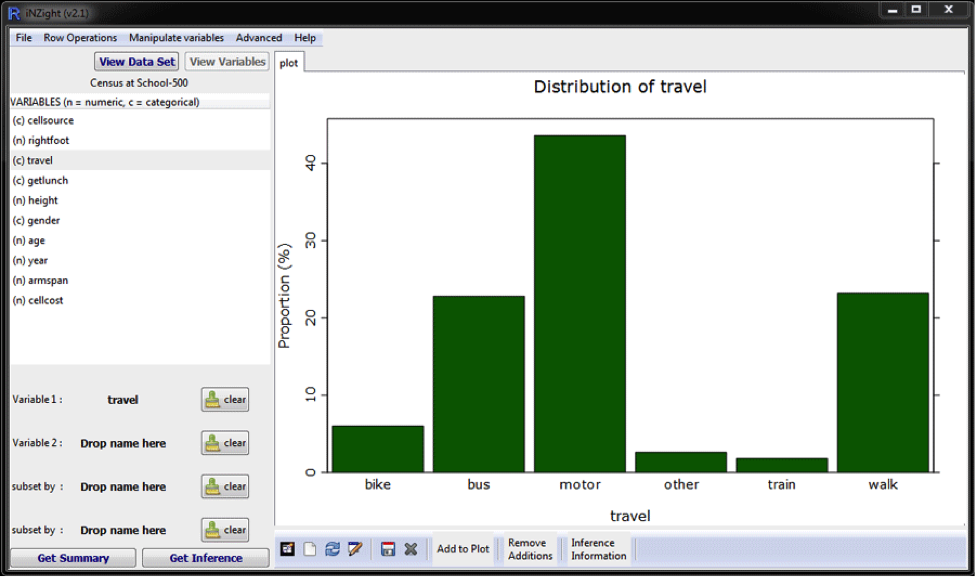
Figure 1: Bar chart of mode of travel to school from a random sample of size 500 from New Zealand Census at School data created by iNZight.
Chris Wild has created a video for getting started with iNZight Lite and there are both help pages and videos for iNZight. As you will see, it is easy to use. It may be easiest to get started using iNZight Lite. Check it out with the Census at School data!
Analyzing Census at School Data (U.S. and International) with iNZight Lite
Census at School is an international classroom project that engages students in grades 4–12 in statistical problem solving using their own real data. Students complete a brief online survey, analyze their class census data, and compare their class with random samples of participating students in their country and other countries. This international program began in the United Kingdom in 2000 to promote statistical literacy in school children and has grown to include the UK, New Zealand, Australia, Canada, South Africa, Ireland, Japan, and the United States.
Under the direction of their teachers, students in grades 4–12 anonymously complete an online questionnaire. The questions ask about such things as the length of their right foot, height, favorite subject in school, and how long it takes them to get to school. Thirteen questions are common to the countries participating in Census at School and each country also adds its own questions specific to the interests of its students. Periodically, the national data from the 13 common questions go to an international database.
Census at School New Zealand now hosts the random sampler for the international Census at School data, the New Zealand data, and also for the cleaned USA data. Their online random sampler allows students and teachers to take random samples up to size 1000 from the international, New Zealand, or U.S. database and either download the data or start up the online iNZight Lite software with the data already loaded and ready for analysis. Census at School – United States also provides a Random Sampler tool to generate a sample of USA Census at School data. This provides access to the messy U.S. data that has not been cleaned and does not yet have the option for automatic download into the iNZight Lite software through the U.S. site.
It is easy to explore Census at School data with iNZight Lite. The following graphs and numerical summaries were quickly constructed after downloading a random sample of size 1000 from the international data and then another random sample of size 1000 from the U.S. data.
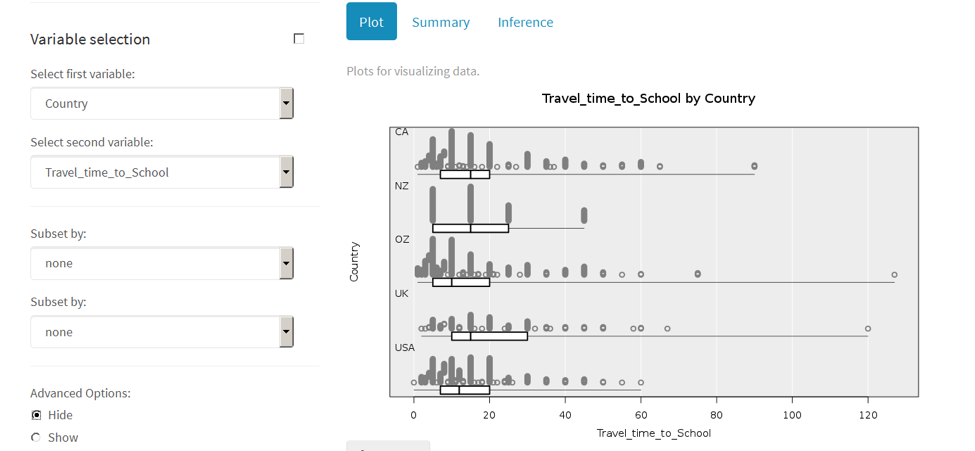
Figure 2: Distribution of travel time to school by country from a random sample of size 1000 from the international Census at School data created by iNZight Lite.
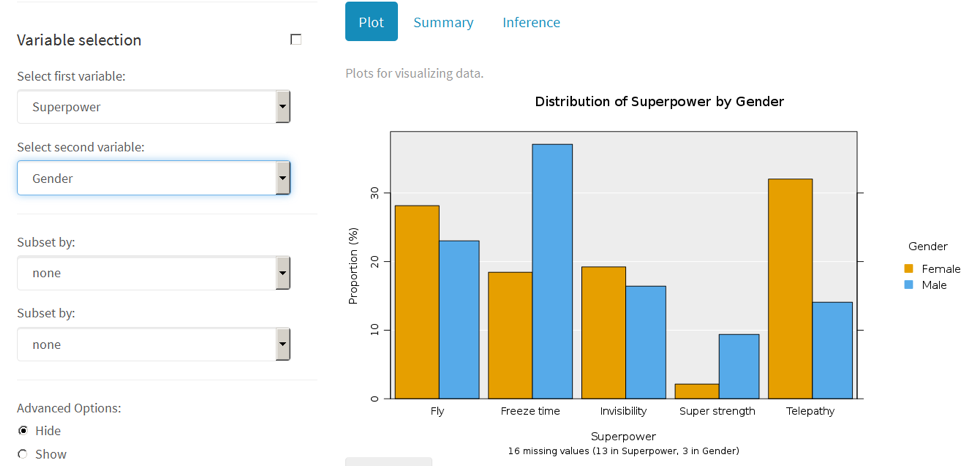
Figure 3: Bar chart of preferred superpower by gender from a random sample of size 1000 from the U.S. Census at School data created by iNZight Lite.
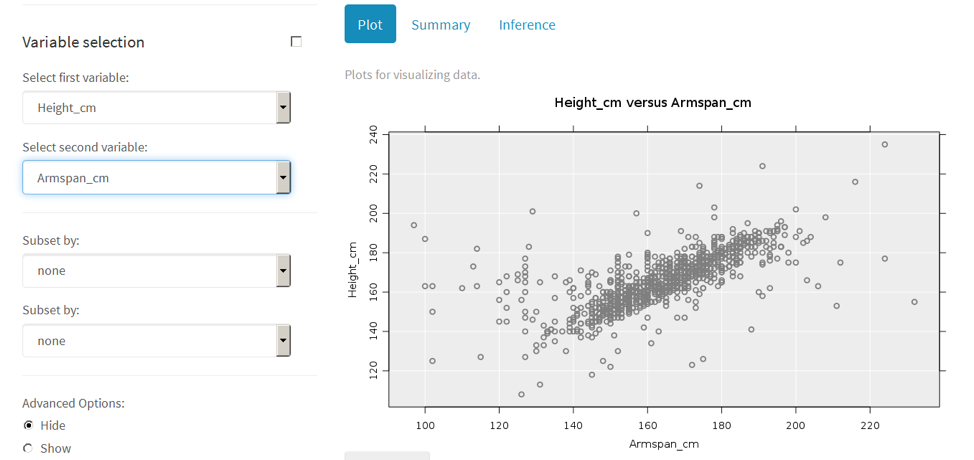
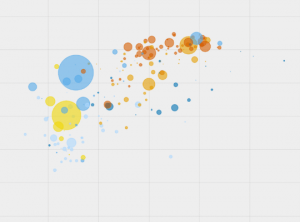
Figure 4: Scatterplot of height and arm span from a random sample of size 1000 from the U.S. Census at School data created by iNZight Lite.
The “Summary” tab immediately above the plot provides the appropriate numerical summaries. The “Inference” tab also provides inferential statistics based on normal theory or bootstrap methods. Because the random samples are taken from the database of students participating in Census at School, we need to be careful of our population of participating students and conclusions. Participation in Census at School is voluntary and the data are not representative of students in a particular state or country in general.
We hope you enjoy analyzing Census at School data with iNZight Lite and consider participating in Census at School with your students. It is free, easy, and provides a variety of numerical and categorical variables to teach the statistics concepts using real data about your students. You can also engage your students in the entire statistical investigative process with Census at School. Students can formulate statistical questions of interest that can be answered with the Census at School data, collect/select the appropriate data, analyze the data including appropriate graphs and numerical summaries, and interpret the results and make appropriate conclusions in context.