Sharing a Birthday: Technology-Supported Investigations in Middle School

Dusty Jones
My daughters Rosalie and Lucy share a birthday, but they are not twins. Rosalie is two years older than Lucy. Most people find this surprising, but my uncle Bruce and his son Jesse also share a birthday. Actually, according to Facebook, I have a few friends who share my birthday.
Although it is clearly possible for two people to share a birthday, our experiences (and intuition) inform us that it is more likely that two people will have different birthdays. That is to say, the probability of a shared birthday between two people is close to zero. However, the chance of a shared birthday may increase if a larger group of people is considered. For example, in a school of 500 students, there must be two students who share a birthday, as there are more students than possible days in the year. In this case, the probability of a shared birthday is equal to 1.
In 1939, Richard von Mises (1939/1964) posed what has become known as the (now rather famous) Birthday Problem: How many people would need to be in a room so that it is more likely than not that at least two of them shared a birthday? In this article, I present a classroom-tested lesson in which 6th-grade students use technology to explore this classic problem.
We began with a brief check of the birthdays of the students in our class. It turned out none of them shared a birthday, and one was born on February 29. Next, I asked students to give examples of events that were “more likely than not” to occur. They offered examples such as, “the trumpets overpower the flutes in band class,” “it snows in New York in January,” and “you draw a blue marble from a bag of five blue marbles and one white marble.” They agreed the probability for an event that was “more likely than not” to occur should be greater than .5. Next, I showed them the Birthday Problem, and they gave initial guesses at the answer. These ranged from 21 to 300; most of the guesses were above 150.
Next, I asked students to view a Google spreadsheet containing data about athletes who participated in the 2010 World Cup. In this international soccer (football) tournament, squads from 32 countries participated, with 23 athletes in each squad. The 32 squads were organized into eight groups, identified by letters A through H. The spreadsheet contains 736 (32 times 23) rows of data, with information about the country, group, jersey number, position, and date of birth. The jersey numbers for the players on each squad were 1 to 23, inclusive. Each squad had exactly three goalkeepers; the other players were defenders, midfielders, or forwards. The date of birth was given as a Julian date in the form of a number from 1 to 365. For example, a January 31 birthday is given as 31, and February 1 is given as 32. This particular data set has no birthdays on February 29, so December 31 corresponds with 365.
In this lesson, students completed several cycles of dividing the set of 736 athletes into subsets of equal size, checking each subset for a shared birthday, and then computing the fraction of subsets that contained shared birthdays. Across these cycles, students were looking for the number of athletes in a subset in which the proportion of sets containing two or more people with the same birthday was close to .5.
Students were able to view the Google spreadsheet, but not edit it. This was intentional, as I didn’t want a student to (intentionally or unintentionally) modify the data during the lesson. However, students were still able to create a temporary filter on their own computers. This allowed different students to examine different subsets without modifying the data.
As a class, we began by examining subsets with 184 athletes—those contained in groups A and B, groups C and D, groups E and F, and groups G and H. This number was selected because it is close to half the number of days in a year and close to some of the students’ initial guesses to the question. First, I demonstrated how to filter the data and show only groups A and B, and then sort by date of birth. By visual inspection, we saw there was a shared birthday within this subset. Figure 1 shows a portion of the spreadsheet using groups C and D.
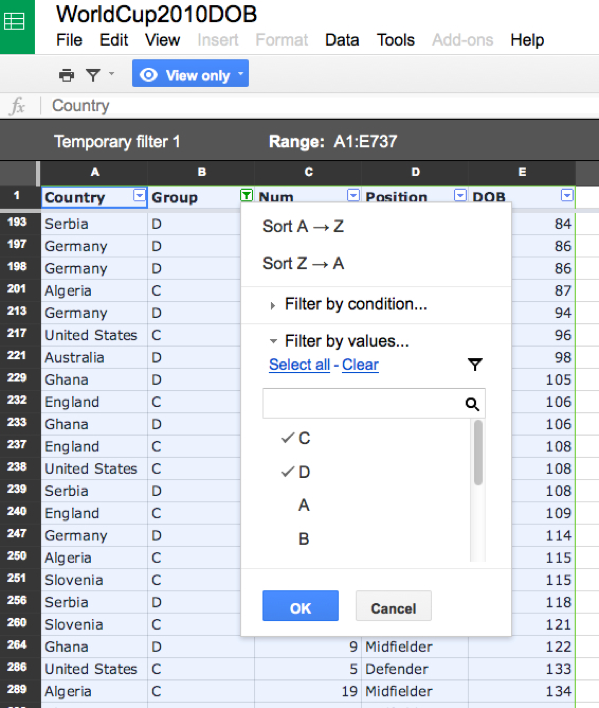
Figure 1. Setting up a temporary filter and sorting by date of birth
To record this information, students were directed to open another shared spreadsheet, in which they could add information about whether birthdays were shared. Next to each pair of groups, students indicated if a shared birthday existed with a “yes” or “no.” They found shared birthdays in each of the four subsets, so the proportion of groups with a shared birthday was 4/4, 1, or 100%. At the front of the room, I began to create a table with the subset description, number of subsets, number of athletes per subset, and proportion of groups with a shared birthday. (A more complete table is shown in Table 1.)
After this, we considered each group as a subset. I added a row to the table on the board and assigned different students to examine each of the eight groups. These eight subsets each contained 92 athletes. Once students recorded their results on the editable spreadsheet, they found that 8/8, or 100%, of the subsets contained a shared birthday.
At this point in the lesson, I asked students for suggestions for addressing the Birthday Problem. Students were convinced the number of athletes in a subset should be decreased to see a decrease in the proportion of groups with a shared birthday. We generated several subsets that would give smaller numbers of athletes in each subset, including the following:
- Non-goalkeepers per group: 8 subsets, 80 athletes per subset
- Pairs of countries (alphabetically): 16 subsets, 46 athletes per subset
- Jersey numbers: 23 subsets, 32 athletes per subset
- Countries: 32 subsets, 23 athletes per subset
- Non-goalkeepers within each country: 32 subsets, 20 athletes per subset
- Goalkeepers within group: 8 subsets, 12 athletes per subset
- Jersey numbers 1–12 within each country: 32 subsets, 12 athletes per subset
- Jersey numbers 12–23 within each country: 32 subsets, 12 athletes per subset
- Goalkeepers within each country: 32 subsets, 3 athletes per subset
Other suggestions were also made, such as forwards within each country, but the number of forwards was not the same for each country. For that reason, this type of subset was not explored.

Figure 2. Checking for shared birthdays within each pair of countries
I had anticipated some of these suggested subsets (such as pairs of countries, countries, and goalkeepers within each group), and had prepared a spreadsheet for students to record their data (see the tabs). As a class, we agreed to investigate the subset of pairs of countries. Students selected a pair, filtered the data, and recorded their result on the shared spreadsheet. They enjoyed being able to choose which countries to investigate, and the spreadsheet cells populated quickly. To help manage things, students were asked to put their name in the Analyst cell while they investigated a subset. Some students were thrilled to be the first to list themselves as an analyst for a pair of countries, such as Slovakia and Slovenia. However, there was also value in other students—those who were not the fastest at typing—to list themselves as Auditor and check and confirm the results of the Analyst. When the Analyst and Auditor disagreed, they discussed the subset and recorded the correct result. Figure 2 shows their results (with pseudonyms for Analyst and Auditor).
Once all 16 subsets were investigated, we found that 15/16, or 93.75%, of groups had a shared birthday. Students were then asked to determine proportions for the subsets they had generated earlier. Here are some of their results, organized by the number of athletes per subset.
Table 1. Results of Examining Subsets of Various Sizes
| Subset Description | Number of Subsets | Athletes per Subset | Proportion of Groups with a Shared Birthday |
|---|---|---|---|
| Pairs of Groups | 4 | 184 | 4/4 = 100% |
| Groups | 8 | 92 | 8/8 = 100% |
| Pairs of Countries | 16 | 46 | 15/16 = 93.75% |
| Jersey Numbers | 23 | 32 | 18/23 = 78.26% |
| Countries | 32 | 23 | 15/32 = 46.875% |
| Non-Goalkeepers Within Each Country | 32 | 20 | 13/32 = 40.625% |
| Goalkeepers Within Each Group | 8 | 12 | 4/8 = 50% |
| Jersey Numbers 1–12 Within Each Country | 32 | 12 | 6/32 = 18.75% |
| Jersey Numbers 12–23 Within Each Country | 32 | 12 | 5/32 = 15.625% |
| Goalkeepers Within Each Country | 32 | 3 | 2/32 = 6.25% |
As a follow-up activity, I asked students to look for patterns in the column of proportions. Some students noted the proportion with a shared birthday decreased as the number of athletes per subset decreased, but other students pointed out this was not strictly true. Specifically, we examined three subsets with 12 athletes: goalkeepers within each group, jersey numbers 1–12 within each country, and jersey numbers 12–23 within each country. These three yielded different proportions of shared birthdays.
At this point, one student volunteered that the jersey number subset was more reliable, since it had 32 subsets compared to the eight subsets of goalkeepers within each group. This student was demonstrating an initial understanding of the Law of Large Numbers: As the number of trials of an experiment increases, the average of the results approaches the expected value. Although this lesson doesn’t deal with random sampling and experiments, it does allow for an initial discussion of some of the concepts that underpin the Law of Large Numbers.
Finally, I asked students to determine which subsets, if any, gave proportions near .5. They found two: goalkeepers within each group (12 athletes, experimental probability 4/8) and countries (23 athletes, experimental probability of 15/32, or 46.875%). Based on the previous discussion about the reliability of probabilities derived from a small number of cases, students were more willing to accept that 23 people (and not 12) was closer to the answer to the Birthday Problem. Interestingly, the result derived theoretically is also 23 people.
At the end of the lesson, I posed several questions to the students to consider. First, is the distribution of birthdays of this set of athletes representative of the set of birthdays of all people? (Outliers: The Story of Success offers some fascinating insight on this matter, with a focus on hockey.) Depending on the answer to this question, how may we relate the results we found with this set of data to form more general inferences? How do our findings match our initial guesses? Additionally, we also discussed how to use the spreadsheets to investigate variations on the Birthday Problem, such as the following:
- How many people would need to be in a room so there was an 80% chance that at least two of them shared a birthday?
- How many people would need to be in a room so it is more likely than not that at least three of them shared a birthday?
- How many people would need to be in a room so it is more likely than not that at least two of them were born in the same month?
Based on the activities in my classroom, I believe it is more likely than not that these questions will stimulate your students’ imaginations and lead to interesting investigations. This example is a nice way to have students investigate and analyze a theoretical problem with a hands-on approach.
Further Reading
Gladwell, M. 2008. Outliers: The story of success. New York: Little, Brown, and Co.
Jones, D. 2013. Happy birthday to … two? STatistics Education Web (STEW): Online journal of K–12 statistics lesson plans.
Lesser, L.M. 1999. Exploring the birthday problem with spreadsheets. Mathematics Teacher 92:407–11.
von Mises, R. 1939. Über Aufteilungs – und Besetzungs – Wahrsheinlichketien. Revue de la Faculté des Sciences de l’Université d’Istanbul, N.S. 4, 1939, 145–63. Reprinted in Selected papers of Richard von Mises 2:313–34. Edited by Philipp Frank, Sydney Goldstein, Mark Kac, William Prager, Gábor Szegö, and Garrett Birkhoff. Providence, R.I.: American Mathematical Society.
About the Author: Dusty Jones is a professor at Sam Houston State University.