
Double Stuffed?

Allison Dorko
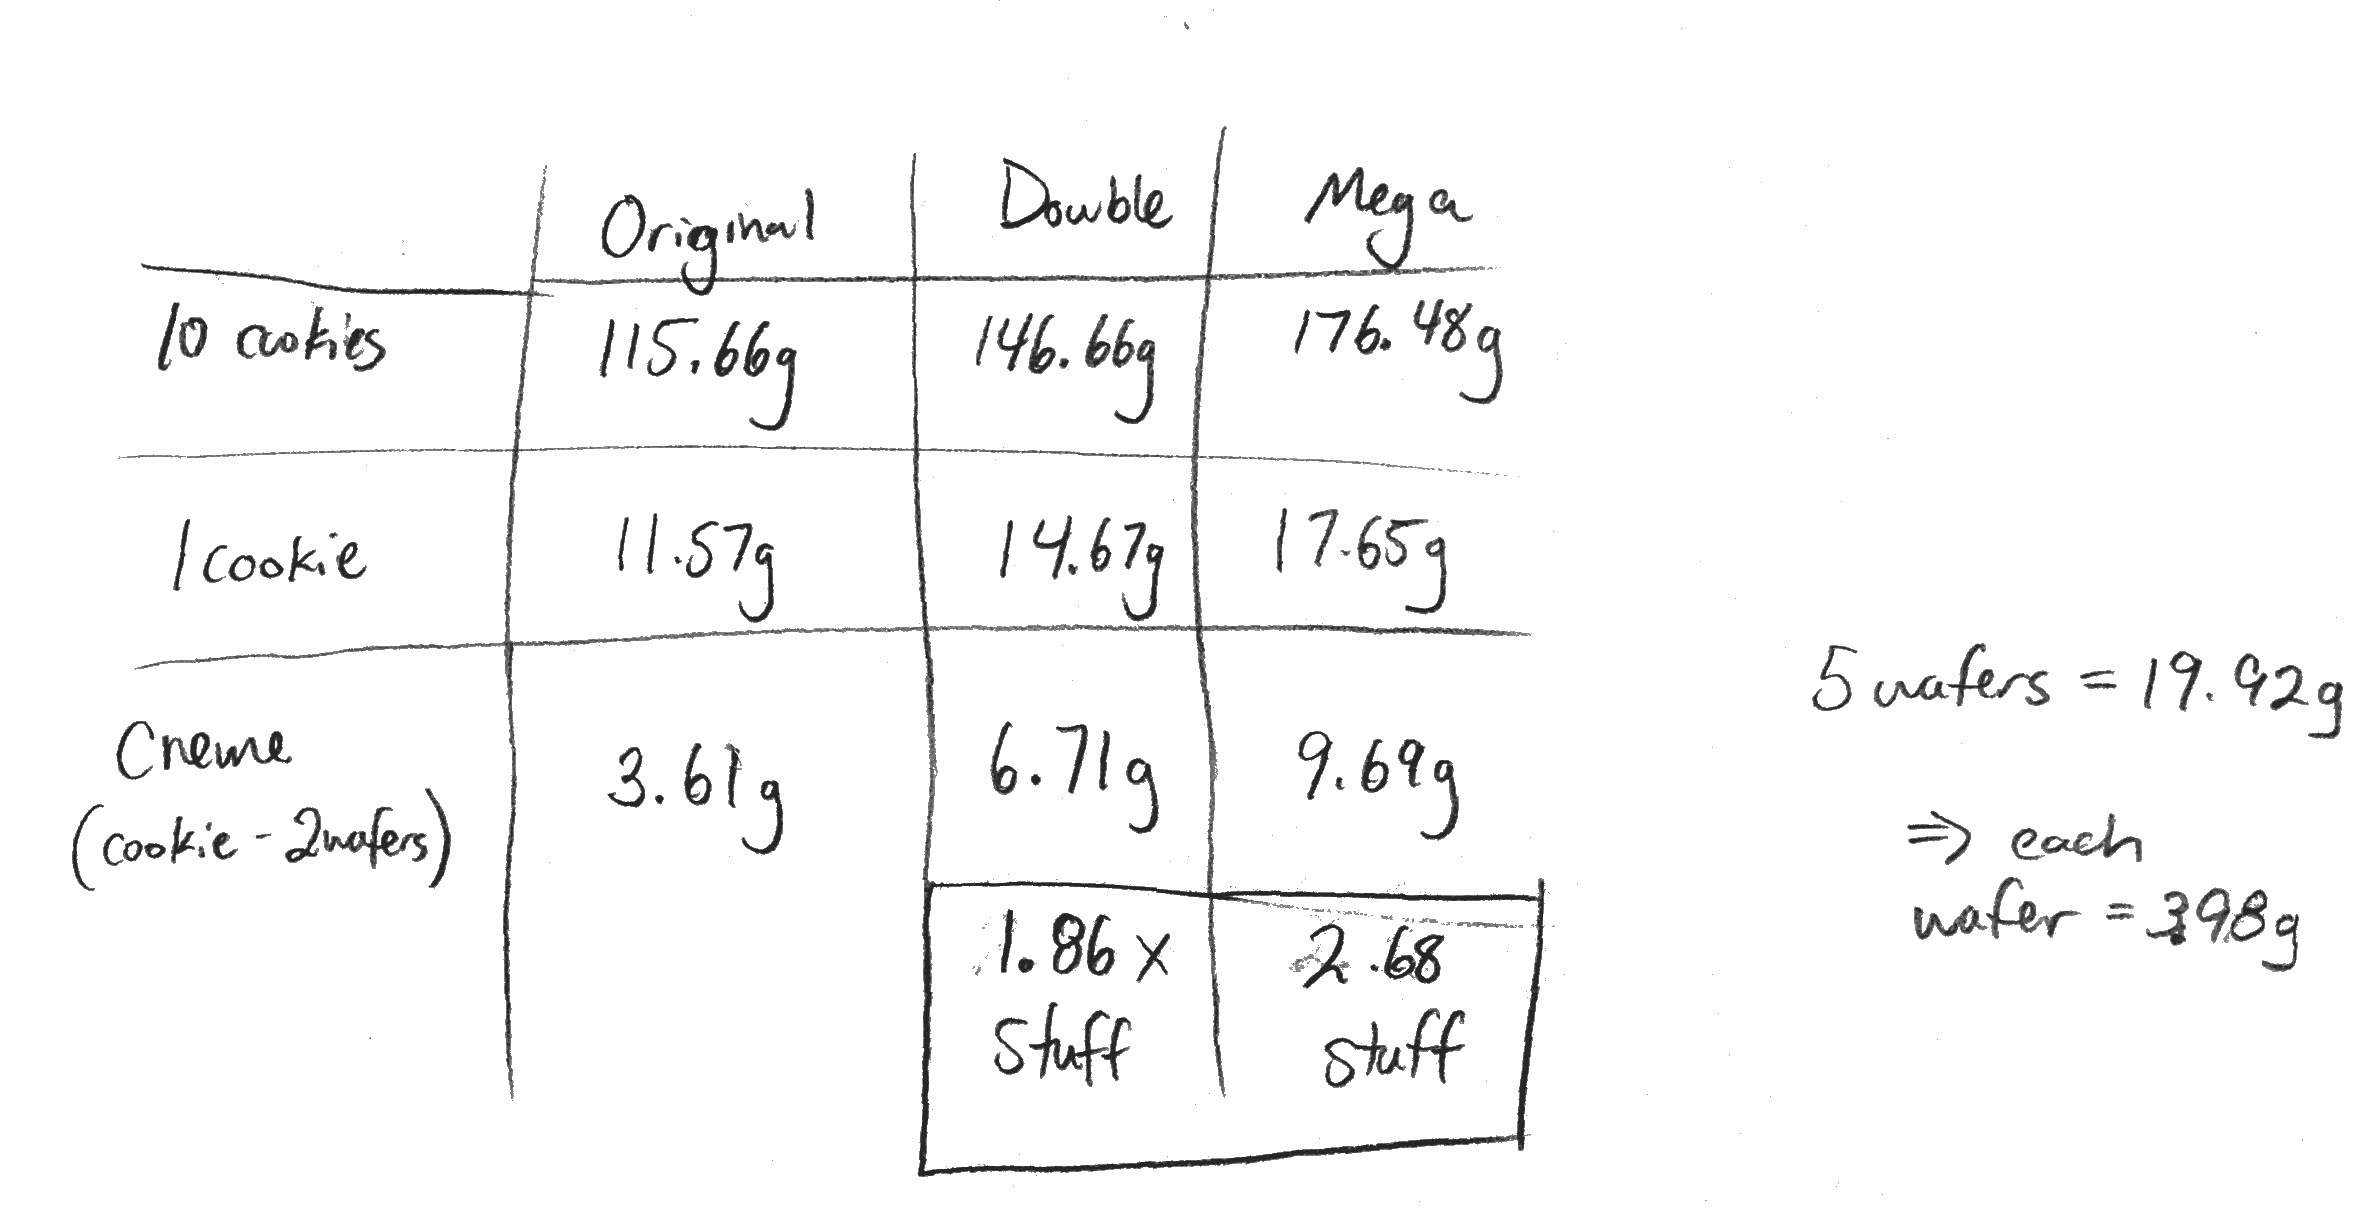
In 2013, a New York high-school statistics class made national news when they investigated whether Double Stuf Oreos truly had double the “stuf.” They took filling from 10 regular Oreos, massed it as one gob, and divided by 10. They did the same with the Double Stuf cookies. The students divided the mean mass for the Double Stuf by the mean mass for the regular cookies and got 1.86, indicating that the Double Stuf cookies did not have double the filling.
The question of whether Double Stuf Oreos actually have double the filling is an intriguing one. In this article, I describe an activity that uses that question as a hook to engage students in finding means, comparing distributions, and performing t-tests. While the New York class’ method is perfectly valid, I like my version of the activity because it incorporates more mathematical content. At the end of the article, I provide an adaptation appropriate for middle-school students.
I suggest using the Double Stuffed? Activity (Figures 1 and 2) after students have learned how to conduct t-tests for two independent samples. As such, prerequisite knowledge includes how to make a histogram, compute means, and compute standard deviations. Students should also know how to perform and interpret a t-test for two independent samples and the assumptions underlying the test. (These prerequisites correspond to Common Core State Standards for Mathematics 6.SP.1, 6.SP.2, 6.SP.5, 7.SP.3, 7.SP.4, S-ID.1, S-ID.2, S-ID.3). I like to form the statistical questions and a plan for data collection as a class, then have students divide into small groups to collect data.
High-School Lesson Plan
The first step in the activity is forming a statistical question. Here’s what we really want to know:
Is there evidence that the mean amount of filling in Double Stuf Oreos is twice the mean amount of filling in regular Oreos?
However, we cannot start with this question, because it assumes Double Stuf Oreos have more filling than regular Oreos. This is a reasonable assumption to make, but it is also one for which we can provide empirical support. Hence I ask students how they could use statistics to establish whether the two types of cookies have different amounts of filling. I pose the question, “How could we establish that Double Stuf Oreos and regular Oreos have different amounts of filling?” If students have been studying t-tests, they should respond with “a t-test!” They might suggest comparing the means, to which you could respond, “What is a statistical method for comparing means?” Students should settle on a t-test for independent samples because we wish to compare whether two groups (filling from regular Oreos; filling from Double Stuff Oreos) have different means and the two groups are independent because they are two types of cookie. I suggest writing the two questions of interest on the board:
- Is there evidence that Double Stuf Oreos and Regular Oreos have different amounts of filling?
- Is there evidence that the mean amount of filling in Double Stuf Oreos is twice the mean amount of filling in regular Oreos?
The next step is to ask students, “What are the null hypotheses for Question 1?” It may help to remind them that null hypotheses tend to state that there is no difference from the mean. For the alternative hypothesis, ask students if they think a one- or two-tailed test is more appropriate. They should say a one-tailed test because there is a direction of interest: It is reasonable to assume Double Stuf cookies have more filling. Students should settle on something like the following:
H01: µDoubleStuf – µRegular = 0
HA1: µDoubleStuf – µRegular > 0
Now your class is ready to collect data. I suggest taking the time to let students offer ideas, as it provides a chance to talk about what ideas will generate the data needed for the t-test. (See Figure 2 for my suggested procedure.) Students need to settle on a procedure that gives the mass of the filling from each individual cookie, because this allows them to compute a standard deviation. In my experience, some students suggest scraping the filling from all the cookies, massing it all at once, and dividing by the number of cookies. While this will give them a mean, they will have no way to compute the standard deviation.
Have students follow an agreed-upon procedure similar to that in Figure 2. Now they have data and histograms! Ask students if the assumptions for the t-test are met. The samples are independent because they are two types of cookie. Check the normality assumption by examining the histograms. In my experience, the data tend to be normally distributed. Hence we can perform the test. Have the class agree upon an alpha level, then have each student run the test using computer software or by hand.
Students should find a p-value such that p < 0.05. I ask them what this means in terms of the hypotheses. They should compare the p-value to the alpha level and decide that since p < α, we should reject the null hypothesis. I ask what this means in terms of the cookies. They should say we have evidence that Double Stuf Oreos have more filling than regular Oreos.
How do we test whether Double Stuf Oreos have double the filling? Students will likely suggest multiplying the regular filling masses by two and running a t-test. Ask them to write the null and alternative hypotheses. Remind students the null hypothesis is that there is no difference between the two means. In this case, our two means are the experimental mean of the Double Stuf filling masses and the mean of our regular filling masses, multiplied by two. In the alternative hypothesis, we want a two-tailed test because we do not know if the Double Stuf cookies have less than twice the filling, twice the filling, or more than twice the filling as the regular cookies. Hence the hypotheses are:
H02: µDoubleStuf – µ2Regular = 0
HA2: µDoubleStuf – µ2Regular ≠ 0
Have students multiply each regular filling mass by 2 and compute the new mean and standard deviation, set an alpha level, then run the test. My data sets have always found p > 0.05, meaning we fail to reject the null hypothesis that there is no conclusive difference between the filling masses for regular and Double Stuf cookies.
However, there is a caveat with how we performed our test. Ask students to compare the standard deviation of the 2xRegular data to the standard deviation of the Regular data. What happened? Students should observe that the standard deviation increased. In particular, it doubled. Now ask students to compare the standard deviation of the 2xRegular data to the standard deviation of the Double Stuf data. In my experience, the standard deviation for the 2xRegular data is greater than the experimental standard deviation of the Double Stuf (e.g., σDoubleStuf = 0.14, σ2Regular = 0.21). Ask students why this might be important. The answer lies in the manufacturing process. While the machine that puts filling in the Double Stuf cookies does not put the exact same amount of filling in each cookie (which we can see from our data), the variance for our 2xRegular data is much larger than the experimental Double Stuf standard deviation. It is important that students note that our method is not perfect, as it assumes more variation than likely exists. This discussion is a nice way to highlight the limitations of a mathematical model.
Middle-School Lesson Plan Modification
Middle-school students can explore the Double Stuffed? questions stated above by comparing the shape, center, and spread of the two filling distributions. Students should follow the procedure outlined in Figure 2, then compute the mean and range for each data set.
Regarding the first question, whether Double Stuf Oreos have a different amount of filling than regular Oreos, students might notice the two distributions do not overlap (this is also evident in that the ranges do not overlap). They might also notice that the mean of the Double Stuf filling mass is about twice that of the mean of the regular filling mass. If students struggle in answering this question, I suggest asking them to compare the center and/or spread of the distribution. This helps them focus on comparing means and/or ranges, respectively.
Once students have agreed that the two types of cookies have different amounts of filling, ask whether they think the Double Stuf cookies have double the filling. Students might say yes, because the mean of the Double Stuf filling mass is about twice that of the mean of the regular filling mass. Others might say no, because not all of the Double Stuf filling masses are double the mass of the regular. For instance, in some of my own data, there are some regular filling masses of 3.2 g and 3.3 g and some Double Stuf masses of 5.8 g and 6.0 g. Lead students in a discussion about variation, pointing out that while not all the Double Stuf filling masses are double the mass of the regular cookies, it seems that, on average, the Double Stuf cookies do have double the filling. (This has been my conclusion; your data sets may vary). While these students may not continue with the statistical t-test, the activity provides a nice way for them to analyze real-life data descriptively and make assumptions prior to testing knowledge.
I hope your students enjoy this use of mathematics to answer a real-life question. They will certainly enjoy eating the data source!
Further Reading
www.cnn.com/2013/08/21/us/oreo-high-school-experiment
blog.recursiveprocess.com/wp-content/uploads/2013/03/IMG_0996.jpg
About the Author: Allison Dorko is a doctoral candidate in mathematics education at Oregon State University.


