

By Beth Chance and Anelise Sabbag, Cal Poly-San Luis Obispo
When 2020 pitched its curveball at educators, one of the largest challenges we faced was finding equitable, meaningful assessments that could be delivered remotely. In other words, could we write exam questions we thought students would find authentic and still allow us to feel confident we were learning about students’ individual achievements?
We experimented with creating multiple versions of each exam and using tools such as “lock-down browsers” with some success but also some concern over student privacy and equity. Over the summer, we attended and gave workshops, and assessment—especially academic integrity—was the primary focus.
As we continued to brainstorm, we realized we were often returning to some old advice, including the following:
According to David Rettinger in a 2020 webinar titled “When Good Students Make Bad Decisions: The Psychology of Why Students Cheat,” if the questions are of high quality, they will still elicit student thinking and uncover common misconceptions. If students believe the assessments to be meaningful and fair, they are less likely to be motivated to “cut corners.”
We are not claiming we can provide “cheat-proof” questions, but perhaps questions in which such strategies tend to be less successful, without causing undue burden on the instructor. We think using different types of exam questions is one strategy, in addition to using other assessment strategies (e.g., projects, writing assignments, presentations, discussion boards) in the course and having open conversations with students about academic integrity. (Rettinger also cites “honesty pledges” at the beginning of an exam to have a modest positive impact.)
Alternative Question Types
Multiple Choice
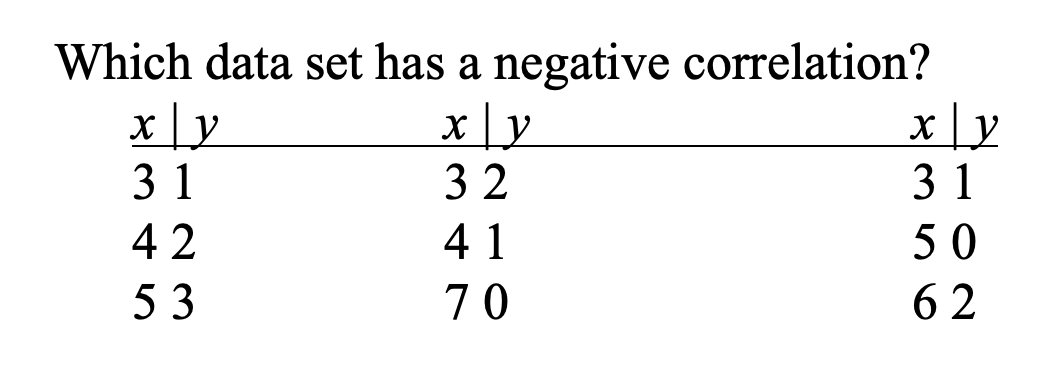
Although we much prefer open-ended responses for assessing student understanding and developing communication skills, this is not always feasible. Our recommendation is to use enough auto-graded questions that you can feasibly grade the open-ended questions. But with the multiple-choice questions, consider mixing in some that focus on statistical thinking, rather than only definitions and calculations. For example, rather than asking students to calculate a correlation coefficient, you can focus on whether they understand what the coefficient is measuring. Following is an example:
Instead of asking students to calculate a mean or median, or even how they relate, you can focus on whether they understand what these quantities measure. For example:
Consider these two new statistics we haven’t studied yet:
- Midrange = (minimum + maximum)/2
- Midhinge = (lower quartile + upper quartile)/2
- Is the midrange a measure of center or a measure of variability? (Choose one)
- Is the midhinge a measure of center or a measure of variability? (Choose one)
- Is the midrange resistant to outliers? (Yes or No)
- Is the midhinge resistant to outliers? (Yes or No)
We have modified this question to be less “Googleable,” giving the statistics generic names and assessing students’ ability to apply the reasoning they have learned to this new situation.
When designing multiple-choice questions, a helpful strategy is to mine student responses to open-ended versions you have used previously. Keep answer choices homogenous in content and grammatical structure and avoid making the correct answer the longest one. A 2002 Applied Measurement in Education article by Thomas Haladyna, Steven Downing, and Michael Rodriguez, “A Review of Multiple-Choice Item-Writing Guidelines for Classroom Assessment,” offers a review of multiple-choice item-writing guidelines.
Some course management systems also allow you to give partial credit for answers that aren’t as good as the full-credit answer, but still reasonable. We also encourage you to include an empty question at the end of the exam where students can explain their reasoning if they didn’t like the answer choices provided or thought they needed to make assumptions. This can help relieve student anxiety over multiple-choice questions.
Multiple Choice Questions with Explanation-Oriented Options
One often-cited limitation of multiple-/choice questions is the inability to know why students are picking the choice they pick. One way to address this is to include reasoning justifications in the answer choices. Following are examples:
- We have strong evidence that Mercury is not randomly picking a container because 16 out of 20 (0.80) rarely occurs by chance (if Mercury is just guessing), leading to a small p-value.
- We have strong evidence that Mercury is not randomly picking a container because the statistic of 0.80 is larger than 0.5.
- We have strong evidence that Mercury is not randomly picking a container because 0.80 is likely to happen by chance (if Mercury is just guessing).
- We have strong evidence that Mercury is randomly picking a container because the distribution of the proportion of heads (proportion of times Mercury picks the container with more bananas) is centered around 0.5.
- We have strong evidence that Mercury is randomly picking a container because we obtained a large p-value.
You can balance choices that reject with choices that fail to reject for different reasons to clarify students understand the correspondence. You can also ask students what they expect to see and why (e.g., “I expect to see a distribution that is approximately normal because the sample size is large.”).
The figure below shows a simulation-based p-value and a theory-based p-value.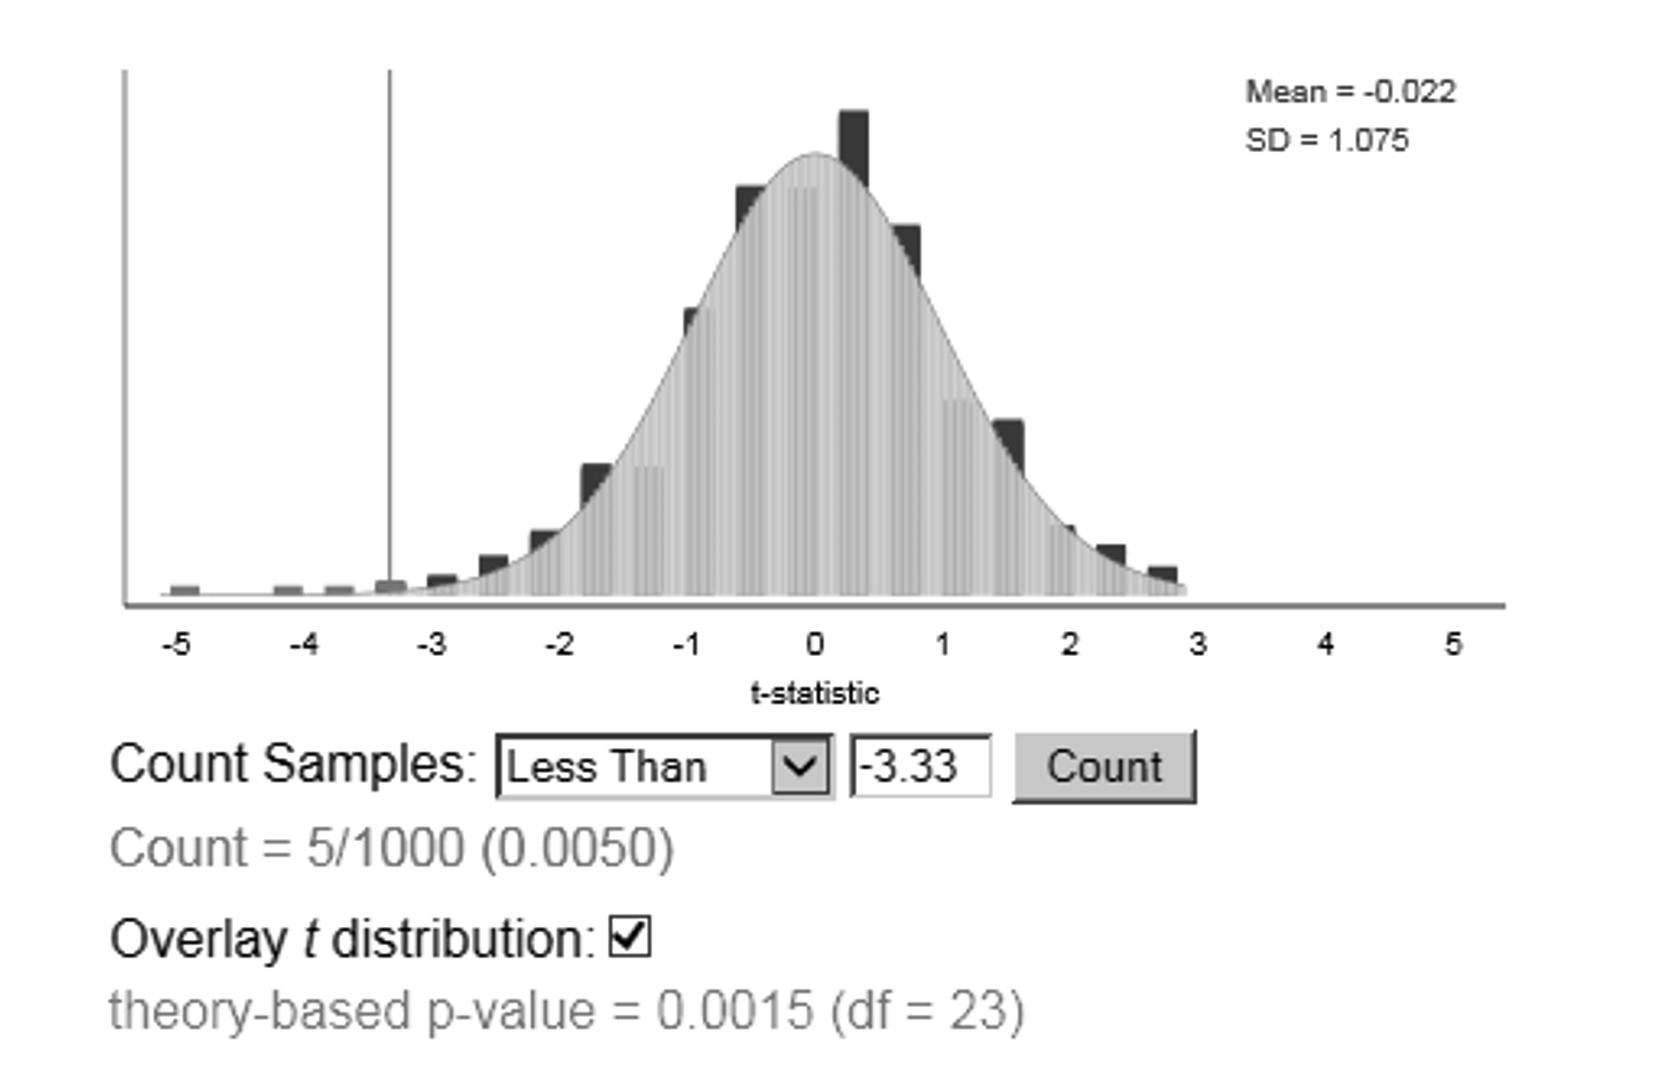
Which p-value would you use?
- It is always preferred to use the theory-based p-value.
- I would use the theory-based p-value because it is smaller.
- I would use the simulation-based p-value because it is larger.
- I would use the simulation-based p-value because it is more valid.
Objective Format Questions
In “Assessment and Process of Learning Statistics,” published in the Journal of Statistics Education, Ruth Hubbard also describes different types of “objective format questions” such as matching problems, comparative judgments, and questions with missing pieces of output. Even if students are taking exams online, you may not want them using statistical software. You can present them with partial output and ask them to fill in a missing piece (e.g., a partial ANOVA table) to confirm they understand the connections. You can also assess their use of software (e.g., an applet) by giving them the opening screen in the applet and asking them to fill in the input boxes (e.g., sample size, observed statistic). You can give them several pairs of mosaic plots and see whether they can select the one that displays the strongest association between the variables. You probably do give matching problems, but consider using more graphs among the answer choices.
Consider the following four distributions of quiz scores: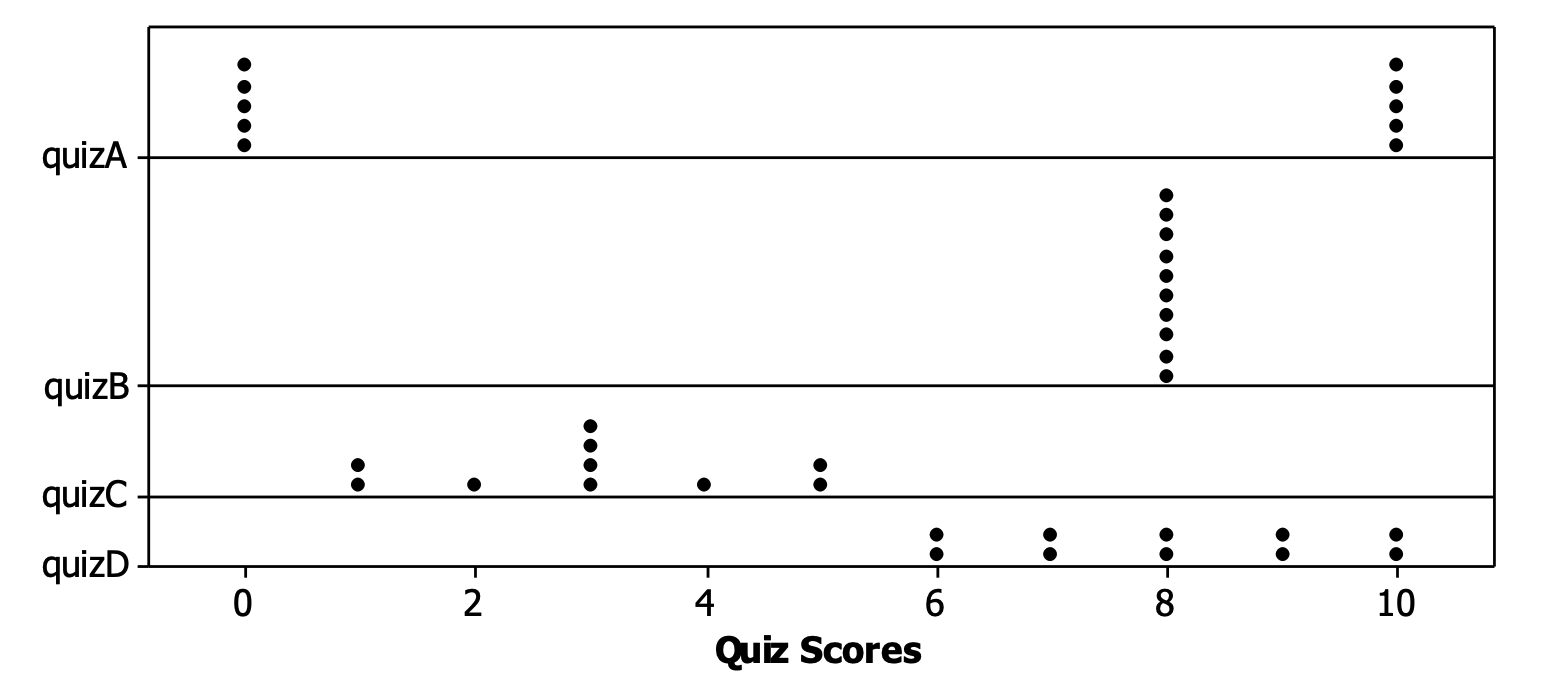
Arrange these in order from smallest standard deviation to largest standard deviation. (Just write in the letters A, B, C, D.) Note if you think there are any ties. Do not bother to calculate any standard deviations.
Follow-Up Explanation of Multiple-Choice Response
We are encouraging use of multiple choice for the ease of auto-grading, but another strategy we have found success with is asking students to explain why one of the answer choices was wrong. This gives students an opportunity to use their own words, giving you tremendous insight into their thinking, and it add richness to the multiple-choice question (less easy to guess the right answer as the longest option). We recognize this now means you are reading student responses, but we think grading this type of follow-up question is much more direct and efficient than most open-ended interpretations.
(a) Suppose your friend finds a confidence interval to be (0.4447, 0.4953). Which of the following is the best interpretation of this interval?
- We are 95 percent confident that 44.5 percent to 49 percent of parents who work full time have kids learning remotely during the pandemic.
- Ninety-five percent of parents with kids learning remotely during the pandemic work full time between 44.5 percent and 49.5 percent of the time.
- There is 95 percent confidence that 44.5 percent to 49.5 percent of the sample works full time.
- Ninety-five percent of intervals constructed this way will be between 0.447 and 0.4953.
- There is 95 percent certainty that the proportion of parents of kids working remotely during the pandemic who work full time is between 0.445 and 0.495.
- There is a 95 percent chance that the proportion of parents of kids working remotely during the pandemic who work full time is between 0.445 and 0.495.
(b) For one of the incorrect statements given in the previous question, explain why it is incorrect.
‘What Went Wrong’ Questions
Students are often reluctant to share their thinking because they don’t want to look foolish or be critiqued. Educators understand students learn from their mistakes, but it can still be a frustrating experience for many students. One option is to show them other student “wrong” answers and ask them to identify this mistake and/or fix the response. This engages students in the review and reflection stage, while lowering some of the barriers for participation. Students are often much more comfortable with spotting someone else’s mistake and, as with collaborative groups, can learn from instructing another student.
Describe what, if anything, is incorrect about each of the following hypothesis statements:


Data were gathered on 106 statistics students from a mid-western college on variables, including the sex of the respondent and whether they had eaten breakfast that morning. This data is shown in the table below:
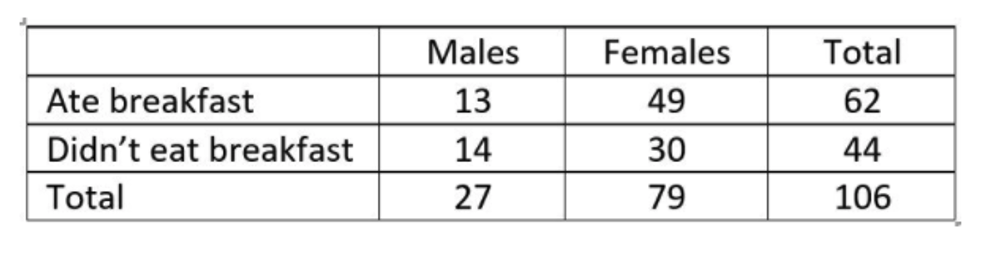
Suppose Ezra is interested in testing whether there is an association between sex of respondent. Ezra says there is evidence of an association because 62/106 >> 44/106. Explain to Ezra the error in his analysis.
‘What If’ Questions
Whether or not you have the opportunity for students to carry out analyses during the exam, you can present them with output/results and ask them how things would change if you tweaked parts of the output (reminding them they are not expected to carry out the new analysis). For example, how would the confidence interval change if the sample size was increased? Width? Midpoint? What if this outlier was removed? How would that affect the t-statistic? These can often be given as multiple choice (larger/smaller/no change/can’t be determined), as well.
The graph below shows the length of time it took singers to sing the national anthem at the Super Bowl. This data set has a mean of about 108 seconds and a standard deviation of about 19 seconds.
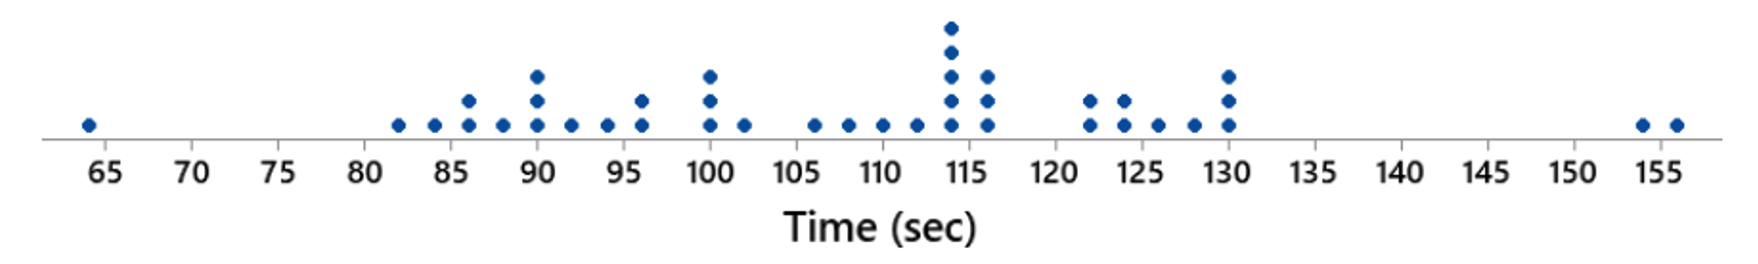
The shortest time of 64 seconds occurred when Neil Diamond sang the national anthem in 1987. Suppose you remove this value from the data set. What will happen to the values of the mean and standard deviation?
‘Construct an Example Where’ Questions
Similar to the “work backward” questions, you can ask students to construct a data set with certain properties (e.g., list 10 values between 0 and 100 where the mean is less than the median and the interquartile range is 0). If students understand the properties, these are not difficult questions. Similarly, can they construct a two-way table that exhibits Simpson’s Paradox? This is a more difficult question, but less so if they really understand the cause of the paradox. Or give them a bar graph and ask them to create a new graph that would have a smaller p-value.
Question: … Here are the results of the study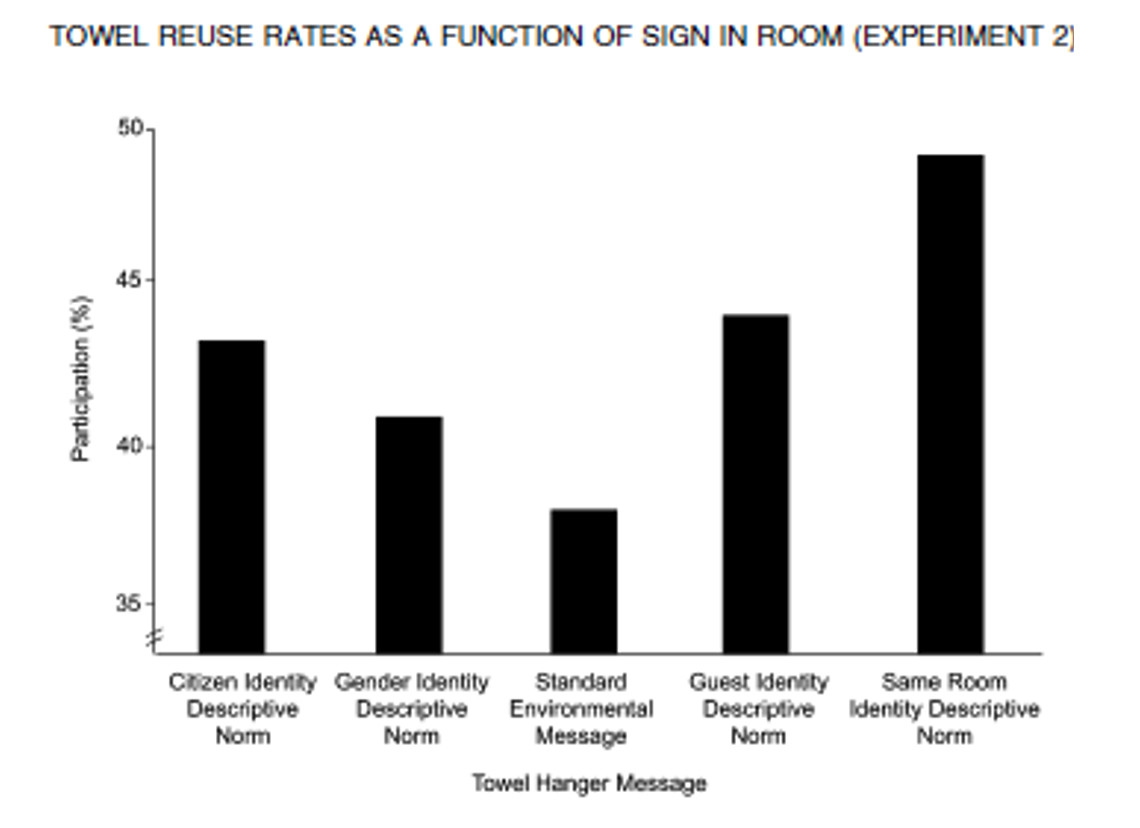
Make up hypothetical data and sketch a new graph to the right of the one above but in a way you think your data will have a smaller p-value than the actual data. Briefly explain your reasoning.
‘Free Response’ Questions
These also aren’t a new suggestion, but consider having different components to your exam that include a more in-depth investigation in which students can use more resources. (For example, like the Advanced Placement exam, we often have students submit a closed-book multiple choice portion of the exam and then open a section of more open-ended questions.) The topics of these questions can also be more “open choice,” so there isn’t only one correct answer or answers that are too similar will be spotted easily. For example, you can give students output from a statistical package and ask them to generate an appropriate research question that could result in that output. You can ask them to describe a situation in which one might use a sample statistic to infer something about the population.
The underlying principle of all statistical inference is that one uses sample statistics to learn something (that is, to infer something) about the population parameters. Convince me that you understand this statement by writing a short paragraph describing a situation in which you might use a sample statistic to infer something about a population parameter. Clearly identify the sample, population, statistic, and parameter in your example. Be as specific as possible, and do not use any example we have discussed in class.
Or tell them to propose a research question that involves comparing two treatments on a quantitative response and have them design the experiment, describe the graphs they would explore, name an appropriate inferential procedure and tell how they would check its validity, and summarize the conclusions they would draw if the difference turned out to be significant. Even though everyone will choose different topics, the rubric can focus on the same questions, including whether the proposed study is a randomized experiment, whether they identified an appropriate procedure, and whether they addressed causation and generalizability in the conclusion.
With sufficient structure, such responses can be substantially more manageable to grade than a term project. We aren’t suggesting replacing group projects, especially for assessing students’ ability to go “beyond” the textbook, but this could be a follow-up assessment of that experience. They can also be helpful in ensuring students focus on the big picture and feel empowered to carry out their own statistical investigations moving forward.
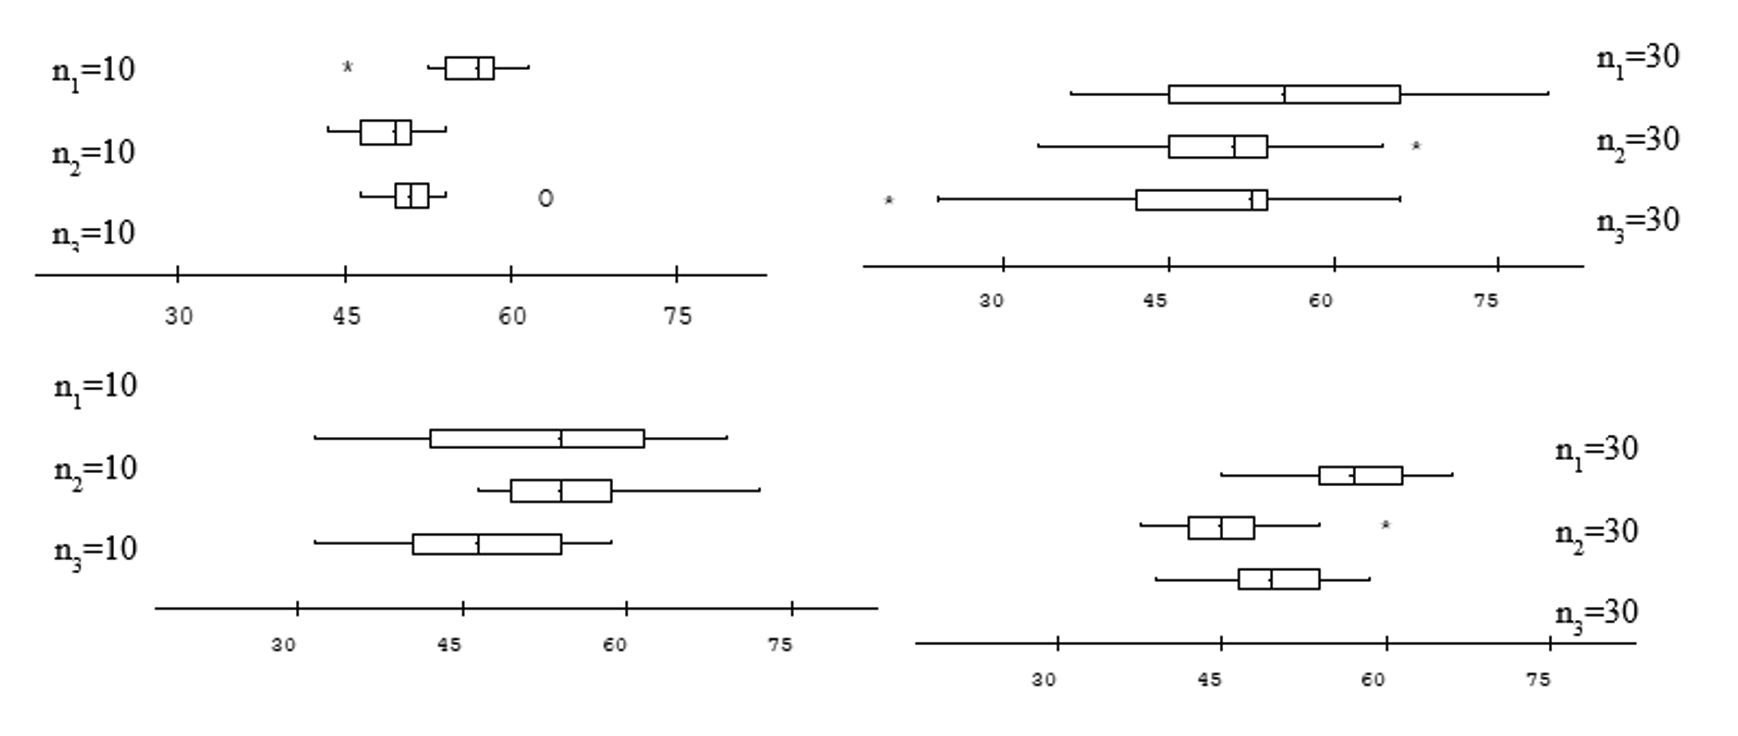
In developing a new open-ended question, we encourage you to develop (and continually revise) the rubric, as well. Many broad questions can be distilled into a few key features. For example, we might use a question in which students need to order a set of boxplots by the size of the p-value:
Suppose we want to test H0: μ1 = μ2 = μ3. Order the p-values from largest to smallest. Explain your reasoning. Your response will be scored on your justifications.
The explanation of student reasoning is the key to this question, something that needs to be clearly communicated to them with earlier examples. But then the rubric can focus on which factors the student discusses:
Rubric
- 5: Student considered differences in centers, amount of overlap, sample sizes
- 4: Student considered two of these
- 3: Student only compared the means/medians
While it may take a while to become comfortable with such a rubric, we have found we are able to grade questions like this fairly efficiently after a few implementations.
For more examples, visit the ARTIST (Assessment Resource Tool for Improving Statistical Thinking) website.
Final Thoughts
One of the largest sources of anxiety with online exams is technology failures and interruptions. You might consider giving students more flexibility when they take the exam. You might also consider giving more time on the exams, as well as allowing them to use their own notes and/or textbook. For many years, we assumed this would dramatically increase test scores, but that hasn’t been the case, though it does require us to write different kinds of questions—ones that look for more thought and application vs. regurgitation. Rather than fighting with the students over what are allowable resources, give them access to more resources and assess their problem-solving ability—a process that is more reflective of their life after college.
Finally, you might want to consider giving students the opportunity to collaborate with their classmates on assessments. If you are not comfortable with a group exam, maybe consider a paired quiz or group assignments. There is evidence supporting the use of collaborative activities and assessments in online introductory statistics courses, as well as in face-to-face courses (see “Evaluating Two Models of Collaborative Tests in an Online Introductory Statistics Course”).
We think students make the largest gains in their understanding when they have to argue and debate with each other to come up with a common response. If students can record these interactions in written form, the instructors can see this exchange of information and transformation in students’ thinking.
You can also allow students to work together on a quiz or collaborate on a worksheet (e.g., with Google Docs). For the latter, you can ask them to color code their responses to help you monitor participation level. We think these collaborative opportunities on a lower-stakes assessment can also be helpful in reducing overall anxiety on individual assessments.
Our last piece of advice is to try just a few such questions at a time. In particular, it is important to prepare students for these “different kinds” of questions. You can give them questions like the above examples on quizzes before an exam and let them know these are the kinds of questions they can expect to see on the exam.
It’s important to maintain the inter-connectiveness of the different course components. For example, encourage them to write short reports and learn from your feedback before assigning a broader project. We don’t think much can replace the student experience with a genuine, messy data set of their own choosing, but it’s also important to have follow-up assessments so they know what you value in their work, as that is what they pay most attention to.
Assessment should be multi-faceted and provide students with multiple opportunities for success (e.g., combining exams with projects), with built-in feedback loops and indicators to students for how to improve their performance (see “Rethinking Assessment of Student Learning in Statistics Courses”). One option is giving students the opportunity for resubmission, but also designing your overall course assessment strategy so different components of the course are reinforcing and progressive in their expectations. For example, you can post a model solution from a fellow student for Lab 1 with general commentary on how to improve answers on Lab 2. Doing this after the first assignment is submitted, rather than before, prevents students from simply copying a template. It also creates pride for students whose work is selected and demonstrates what is possible to their peers.
With these simple strategies and perhaps mixing up some of your question types, we hope the assessment experience can be positive for you and your students, even during a pandemic, and that some of these strategies will even carry forward once we are back to school.