

By Christopher Engledowl and Tracey Gorham Blanco, New Mexico State University
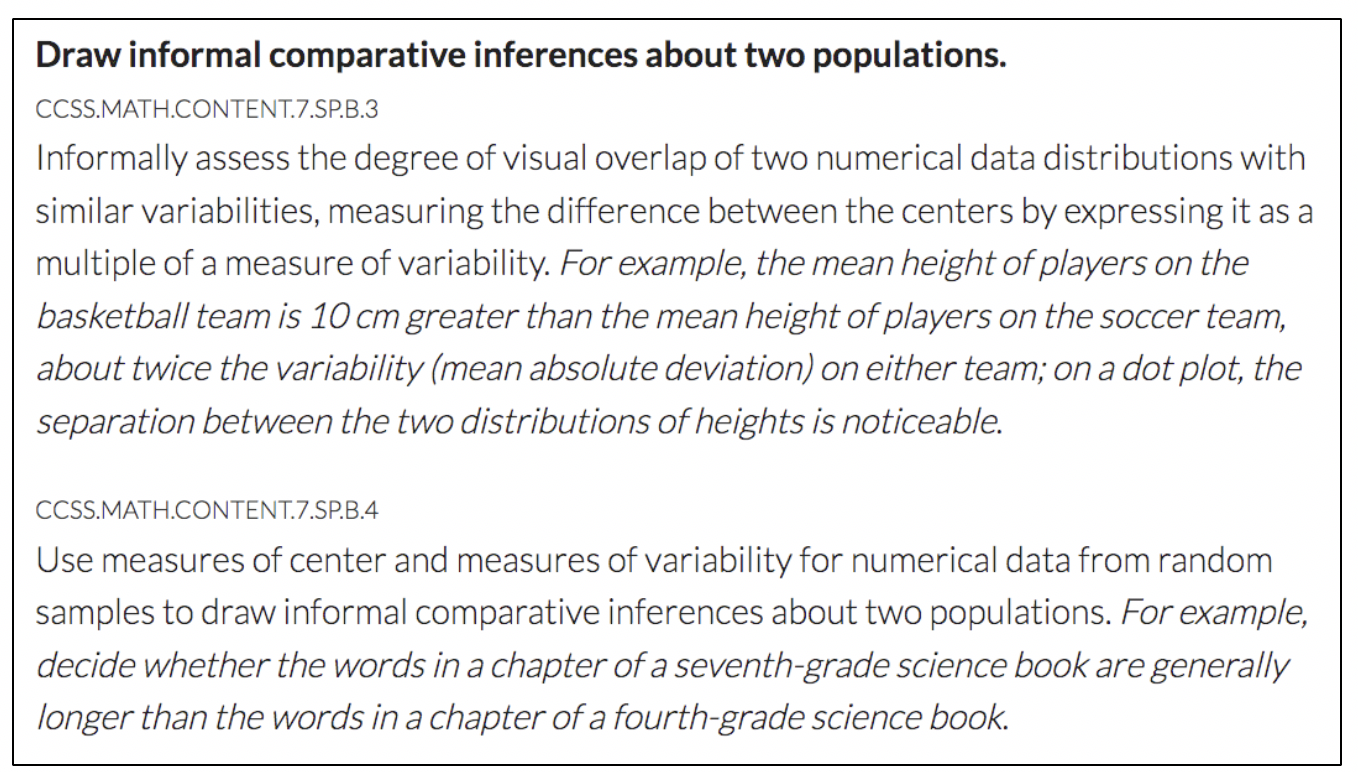
Throughout the past 20 years, it has been largely accepted that statistics is not mathematics, albeit statistics makes use of mathematics. For instance, the Statistical Education of Teachers (SET) report states “teachers also should recognize the features of statistics that set it apart as a discipline distinct from mathematics, particularly the focus on variability and the role of context.” Therefore, both variability and context are intertwined and necessary for full engagement in statistical reasoning. The Common Core State Standards for Mathematics (Figure 1), mathematics Australian curriculum, and other standards documents promote engaging students in informal ways of reasoning around inference that require this combination of variability and context.
Informal inferential reasoning (IIR) involves using informal statistical knowledge (e.g., measures of center, spread, and shape; data displays) to support arguments that make a generalization from a sample to a population or to support an argument that makes claims about causality between variables. For example, when comparing two histograms of mile times for people who ran a 5k versus a half-marathon, someone engaging in IIR might claim that the smaller variability of the half-marathon runners’ mile times indicates people who choose to run in half-marathons are probably more consistent to one another in their mile times than those who would choose to run in a 5k. Someone making an argument that is not IIR would keep the focus only on the runners for whom the data was collected, rather than generalizing to a broader set of people who choose to run in half-marathons.
Moreover, when engaging in IIR, it is vital to develop an ability to weigh the evidence being used to justify claims constructed in the IIR process. Maxine Pfannkuch—author of “Comparing Box Plot Distributions: A Teacher’s Reasoning,” which was published in Statistics Education Research Journal—described it this way:
There is a weighing of evidence to form an opinion on and inference from the information contained in the comparison of distributions. Such informal decision-making under uncertainty requires qualitative judgments, which would seem to be much harder than the quantitative judgments of statistical tests.
Therefore, it is important for teachers and students to have opportunities to grapple with multiple—and possibly conflicting—arguments when constructing inferences, so they can gain experience with the qualitative nature of weighing the evidence of such statements.
Recently, Statistics Teacher published an article showcasing the LOCUS assessment resources as a formative assessment resource for teachers to use with their students. The resources include, for instance, examples of common student misunderstandings and links to other resources related to each assessment task. At first glance, the LOCUS resources might appear to be most useful for practicing teachers as they plan lessons, but they are also important for those working with practicing teachers in a professional learning context.
Many current practicing mathematics teachers likely did not receive much, if any, preparation for teaching statistics (see the SET report and 2018 national survey of mathematics and science teachers report). Thus, when teachers are engaged in tasks such as those in the bank of LOCUS released items, they will initially tend to focus on the more mathematical computation component of statistics. However, teachers can be encouraged to move into the components that are uniquely statistics through many of the LOCUS tasks. For the purpose of discussion, the two released tasks we will focus on are Tomatoes and Fertilizer and Jumping Distances.
Moving Away from Computation-Focused Arguments
Consider part (b) of the Tomatoes and Fertilizer constructed response released item from LOCUS:
A farmer conducted an experiment to find out whether a new type of fertilizer would increase the size of tomatoes grown on his farm. The farmer randomly assigned 10 tomato plants to receive the new fertilizer and 10 tomato plants to receive the old fertilizer. All other growing conditions were the same for the 20 plants. At the end of the experiment, the mean weight of tomatoes grown with the new fertilizer was 0.4 ounce heavier than the mean weight of the tomatoes grown with the old fertilizer.
(b) Based on the results, the farmer is convinced that the new fertilizer produces heavier tomatoes on average. Briefly explain to the farmer why simply comparing the two means is not enough to provide convincing evidence that the new fertilizer produces heavier tomatoes.
This task creates an opportunity for teacher educators to confront practicing teachers with their preference for focusing on more computational components of statistics, as opposed to considering the nonmathematical, uniquely statistical components such as those related to study design or sampling variability (the latter is the focus of this task). For instance, in my work with practicing middle and secondary mathematics teachers, most will first respond similarly to Kathy in Videos 1 and 2 by 1) stating that mean is sensitive to outliers and should not be used or should not be the only measure used, 2) that the farmer should also include another measure of center such as the median, or 3) claiming a measure of spread should also be included.


Although these are not inappropriate on their own—ruling out outlier effects and considering variability are important in statistical reasoning—they are only surface-level suggestions in this context. If such information were to be provided by the farmer, there would still be a lack of evidence for the impact of the new fertilizer on tomato weight.
However, teachers can be probed to consider some of the more problematic issues by simply responding, “Suppose the farmer provided all the descriptive information you are asking for (median, range, standard deviation, etc.). Then, would it be enough evidence?” At this point, teachers may begin to examine the study design and describe potential issues with sample size or the need to replicate the study—including under different conditions—as Amalia did in Video 3.

The move in teachers’ suggestions that the farmer focus on study design flaws indicates a significant shift in their thinking, and such issues are important considerations. However, these arguments still fall short of identifying the type of evidence that would support whether the new fertilizer results in heavier tomatoes. Such claims should be supported by evidence that rules out the possibility that the difference occurred due to sampling variability.
Despite the lack of attention to sampling variability, it is noteworthy that the teachers turned their attention to the nonmathematical components of statistics, and their claims should not be viewed as less valid assertions—albeit less sophisticated. After all, such enhancements in the study design would make the farmer’s claims more believable. Pedagogically, such instances provide an important moment to have teachers reflect on how their current suggestions were different than their initial suggestions—bringing explicit attention to the importance of the nonmathematical component of statistics.
After this discussion, teachers can be brought back to thinking in the uniquely statistical space of the task situation by asking them once again to consider how they would respond if the farmer were to, for instance, use 100 plants or replicate the study. Teachers then may be motivated to 1) state they would be confident in the farmer’s findings, 2) turn to examining the random assignment of plants to treatment and control groups, or 3) more explicitly state the need for ruling out sampling variability as the cause.
For instance, Amalia began to examine the random assignment when considering a possible appropriate student response by stating, “By chance. I could see them [students] saying like, ‘Yeah, by chance that [difference in means] might happen.’” In a more sophisticated response, Tim pinpoints the issue of sampling variability in Video 4.

Depending on teachers’ backgrounds, their responses could be used as either a way to motivate an initial discussion about sampling variability (such as a response like Amalia’s or one indicating no more evidence is needed) or to support teachers’ continued development of the need for ruling out the possibility of a particular finding occurring by chance (such as a response like Tim’s).
Once teachers are observed to be critical of this point, part (c) can be introduced, in which a p-value is provided by the farmer and the same question is posed: “Is there convincing evidence that the new fertilizer produces heavier tomatoes than the old fertilizer on average?” Note that moving into a discussion of p-value is a move away from informal inferential reasoning and into formal inferential reasoning—a step that should not be taken before teachers are adequately prepared to do so.
Encouraging Weighing the Evidence
A task such as Tomatoes and Fertilizer also affords the opportunity to weigh the evidence of the farmer’s inferential statement. Because the farmer is a fictional character, it allows teachers the freedom to be critical of the farmer’s reasoning, rather than their own or perhaps one of their colleagues’. Moreover, the idea of weighing the evidence occurs naturally at each development.
For instance, teachers may initially focus on the mean’s sensitivity to outliers but be motivated to further explore other possible critiques through probing questions. Although this could result in a laundry list of missing information, you can ask the teachers to consider which information would be vital for the farmer to include and why. However, in the context of the Tomatoes and Fertilizer task, teachers are only considering a single inferential statement—that of the farmer.
On the other hand, a task that would afford opportunities to weigh the evidence of multiple inferential statements could be something like part (c) of the Jumping Distances LOCUS released task:
Students wanted to investigate whether the distance a male student can jump is affected by having a target to jump toward. The students decide to perform an experiment comparing two groups. One group will have male students jumping toward a fixed target, and the other group will have male students jumping without a fixed target. There are 28 male students available for the experiment.
After randomly assigning each male student to one of the two groups, data were collected on the length (in centimeters) of the jump for each male student. The data for 28 male students is summarized in the boxplots below.

(c) Write a concluding statement to address whether the distances the male students jumped were affected by having a target? Justify your conclusion.
In this task, there are multiple possible conclusions that can be supported by evidence. For instance, a teacher could claim that having a target to jump toward resulted in more consistent jumping distances because the IQR was smaller for students with a target to jump toward than for those without a target, as Kathy did in Video 5.

On the other hand, a teacher could claim having a target to jump toward resulted in less consistent jumping distances because the range was larger for students with a target to jump toward than for those without a target to jump toward, similar to Kathy’s response in Video 6.

A third argument could also be made that having a target resulted in more consistent jumping distances. The justification would be that, after limiting the range (thus shortening the lower tail) to the lower to upper fence—the cut points for identifying outliers—the range is smaller for the students with a target to jump toward than for those without a target. Another, perhaps more common argument, but not drawing on concepts of variability, can be made that having a target resulted in shorter jumping distances because the median distance was smaller for those with a target than it was for those without a target, as Rosalynn describes in Video 7.

When multiple inferential statements are plausible for comparison, teachers have an opportunity to refine their arguments to include stronger evidence to support their inferences. For instance, at first, Kathy focused on the IQR in making the inference that the no target group was less consistent in their jumping distances. However, after considering the competing argument that the range indicates the opposite effect, she weighed the evidence for these two situations. Ultimately, her argument was strengthened by including both a measure of spread (the range) and a general measure of center (comparing respective quartile locations), and it led her to conclude that the argument drawing on IQR was a weaker argument. Such opportunities support the development of more sophisticated forms of reasoning that draw on multiple statistical measures simultaneously.
Statistics teacher educators should provide space for teachers to consider these multiple perspectives that lead to multiple conclusions or are supported by different evidence for the same conclusion. Doing so not only affords teachers a chance to develop the qualitative decision-making experience that is an inherent component of informal inferential reasoning, but it also provokes teachers to consider the more mathematical components of statistics alongside the uniquely statistical components. Moreover, it allows for teachers to begin to integrate multiple statistical concepts simultaneously, drawing connections between such ideas as center, spread, and shape, thereby supporting the development of higher levels of reasoning.