
By Jane Watson and Noleine Fitzallen, University of Tasmania
This article is based on professional learning devised to help Australian middle-school teachers build an appreciation for randomness before content related to sampling and variables are introduced in later years. It is accompanied by a PowerPoint presentation teachers, teacher educators, and professional learning providers can use to support the development of students’ concept of randomness. Graphical representations here and in the PowerPoint presentation were created using TinkerPlots. The dialogue in this article was originally used in a presentation as part of the Reframing Mathematical Futures II Project at the RMIT University in Melbourne, Australia, under the direction of Diane Siemon. Sue Stack created the cartoon characters.
“Random” is one of those words, the kind with different meanings in different contexts. Students are likely to use “random” as an adjective describing anything unexpected and surprising (e.g., “The goal he scored was totally random.”) or something unexpectedly awesome (e.g., “The whole game was random!”), but these usages are not mathematical. They do, however, provide an opportunity for teachers to discuss the differences between language used inside and outside of mathematics.
Mathematics curriculum documents in various countries (e.g., Australia, New Zealand, and the United States) use the word “random” when describing content learning outcomes for students (e.g., “random sample” or “random variable”). None of these documents in their glossaries, however, define “random” itself. The Common Core refers to “random sampling” from Grade 7, the Australian Curriculum does so from Grade 8, and New Zealand introduces it in Level 6 of its eight-level curriculum across grades 1–13. The question arises concerning the assumptions made about understanding the fundamental concept of randomness.
Randomness
Randomness is one of the five big ideas forming the foundation of statistics (Figure 1).
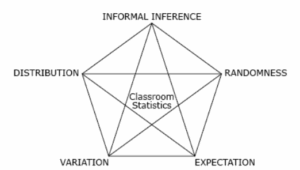
The Top Drawer Teachers: Statistics website is built around these big ideas. Top Drawer Teachers: Statistics gives the following description of randomness:
Randomness describes a phenomenon in which the outcome of a single repetition is uncertain, but there is nonetheless a regular distribution of relative frequencies in a large number of repetitions.
The main focus here is on randomness and its relationship to variation and expectation. The “uncertain” part of randomness is the variation that occurs over repetitions of an event, and the final expectation arises from the “regular distribution of relative frequencies” from the repetitions. Experience from research has shown students readily pick up the variation component of randomness while carrying out trials when learning about probability but often do not realize there is also a specific expectation component, which is the goal of the process. In the classroom, the concepts of variation and expectation need to be reinforced before they can be linked to form the foundation of randomness. Carrying out familiar activities based on trials related to probability can be used to reinforce the relationship among these three big ideas.
In conjunction with conducting trials, classroom discourse can be used to explore, build, and challenge students’ ideas. Mathematical classroom discussions provide situations in which students talk about mathematics, and in doing so, they enhance their learning and reveal their understanding of concepts. The following dialogue illustrates the way in which a teacher can use classroom discussion to draw out and influence students’ understanding of variation, expectation, and randomness. The classroom dialogue was created from actual responses made by students from research projects and interactions with teachers in professional learning sessions. The simulation created is not presented as an authentic “lesson,” but offered as a starting point and a sequence of ideas that can be used to stimulate teacher interaction and contemplation.
The PowerPoint presentation (with “builds”) is provided with this article to enable the material to be used in professional learning sessions with teachers. It includes pauses for teachers to suggest both what their students would say at some points and how they would respond at other times. Extracts from the PowerPoint reproduced in blue type are intended to be used by a presenter with a group of teachers or by the individual reader as introductory material. There are also a few other transition comments not in the PowerPoint. Although the dialogue is set in an Australian context, it can be easily modified for other countries.
Big Ideas Linking Chance and Data with Dice
In thinking about how to move student understanding to a higher level related to chance and probability, remember that students may have intuitive ideas or experiences that are different from the theoretical models introduced in the curriculum. Telling them these models apply for fair dice or fair coins may not be enough to dissuade them from their beliefs. What may be required is a statistical investigation to collect real-time evidence supporting the probabilistic model.
A statistical investigation has the potential to link the two sub-sections of the statistics and probability curriculum: chance and data representation and interpretation. As well, it illustrates three of the big ideas underlying this part of the curriculum: variation and expectation, leading to randomness. This process generates sample data that shows variation. The expectation arising from that variation for large samples leads to confirmation of the theoretical probability model, illustrating a random process.
Revealing Ideas About Variation and Expectation
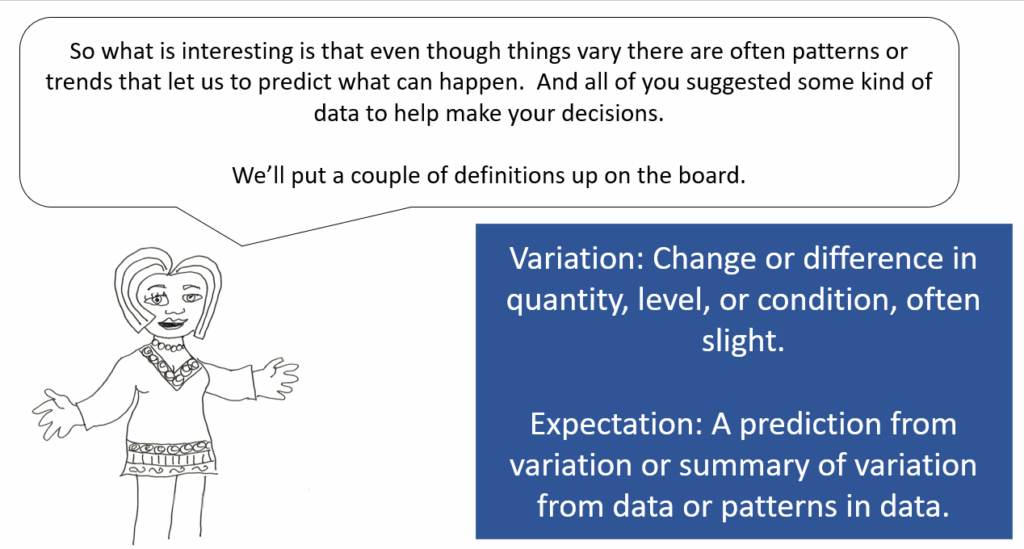
The session begins setting the scene for the probabilistic model by reviewing students’ understanding of the two big ideas of variation and expectation, followed by exploring these ideas with an ordinary six-sided die. Setting the scene involves establishing students’ prior learning and understanding related to intuitive ideas about variation. Before you go further, think about your definitions of variation and expectation. What would your students say?
Teacher: Today, we are starting with two big ideas in statistics: variation and expectation. We are going to explore the ideas using dice.

Teacher: Great examples. Can you think of a definition of variation?
Riley: It’s like things that change.
Mia: They aren’t all the same.
Niko: Sometimes they vary a lot and sometimes a little.
Jack: Sometimes you can measure the difference with numbers.
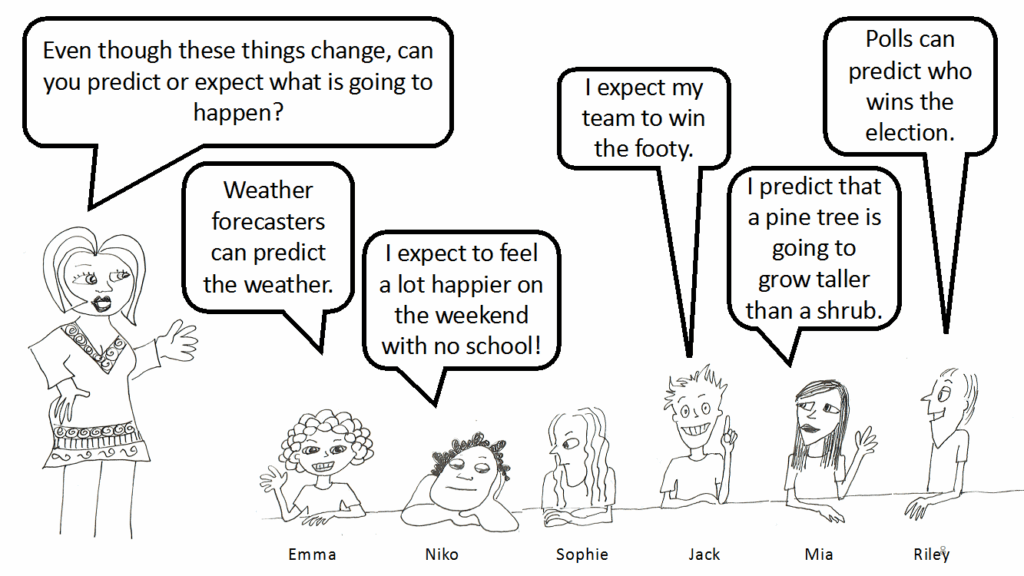
Teacher: Okay, we want to think about how expectation and variation are related. Can you tell us how your predictions or expectations come out of variation?
Emma: The weather bureau gets lots of data from different conditions over time and whether it rains or not. Then, they tell us what to expect.
Niko: Well, five days a week, I have to think and study, and two days, I mostly relax (if there isn’t any homework).
Jack: I look at the past record against the team we’re playing. We win more times than not.
Mia: I could plant lots of trees and shrubs, take care of them, and come back and measure them to see which were taller!! [Riley: How many years would that take?!]
Riley: I’d ask 1,000 people who they were going to vote for.
Introducing the Context for Randomness
The next two sections show the issues the teacher encounters in moving to mathematical randomness. The teacher starts again with variation and then introduces trials to illustrate how expectation develops.
Teacher: So, today, we are going to look at throwing a die. What sort of variation do you think we will see?
Emma: You get different numbers coming up.
Teacher: Like what?
Riley: The numbers 1–6.
Jack: My Dad always gets sixes. I get ones or twos. I’m no good at throwing dice.
Mia: Yeah, you never seem to get the number you want.
Sophie: Especially when you’re starting a game.
Niko: I’d say four because it is my favorite number.
Sophie: But, would it come up all the time?
Niko: Well, mostly.
Teacher: So, what is important when you play a game with dice?
Emma: It has to be fair.
Teacher: But what do we mean by fair?
Jack: It isn’t biased.
Sophie: What do you mean “isn’t biased”?
Jack: I could roll it in one dimension so two sides couldn’t come up or so softly only one number would come up.
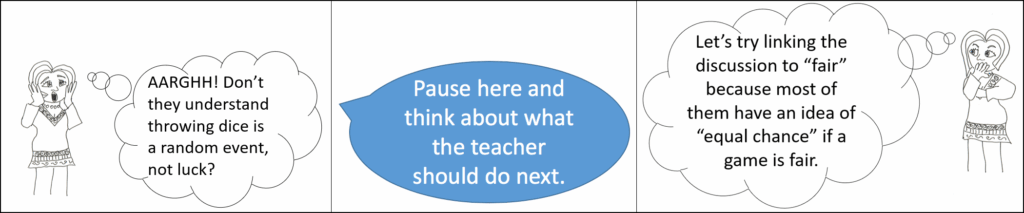
Riley: It needs to be RANDOM!
Teacher: So then, random seems to be a big idea when throwing dice. What do we mean by random?
Niko: Random is like picking a name from a hat.
Mia: But we haven’t got a hat! It’s like “mixed up, not in any order.”
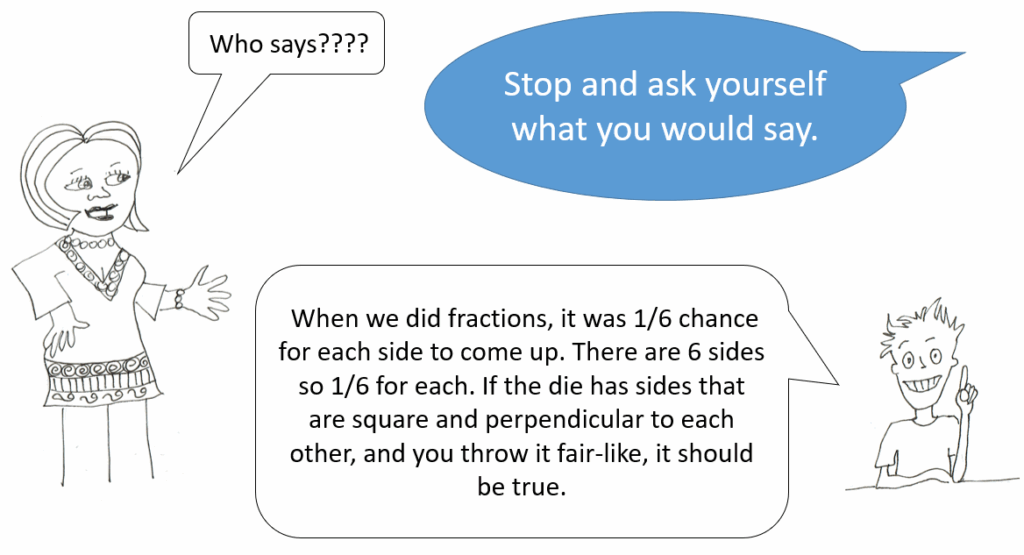
Emma: It’s like you don’t know what’s going to happen before you roll a die but, to be fair, every side has to have a chance.
Riley: I don’t know if “random” is the same as “fair,” but for “fair,” every side has to have the same chance of coming up.
Moving to Expectation
Teacher: Okay, maybe we’re starting to get a feeling for randomness. Turning to our other big idea, expectation, what do we expect when we play a game with dice? Or when we just toss a die?
Riley: We want to make sure they are fair. Even if the outcomes move around randomly, we want them to have the same chance on each side in the long run.
Teacher: How then do we find out if a die is biased or fair; that is, each side has the same chance of coming up?
Niko: Look at it carefully. Is it heavy on one side?
Emma: Do the spots for the numbers make the six-side heavier?
Teacher, having to be more specific: Possibly. So, what do we do to test it?
Sophie: Toss it a few times.
Mia: You can’t tell really because sometimes it doesn’t turn out that way.
Riley: It’s really the luck of the draw. You might get a run of sixes, but then probably the next time, you get a run of ones. It just depends. Sometimes, it might come up more often, but the next time, it won’t.
Emma: But, the chance is supposed to be equal.
Teacher: Okay, you are going to test this with some dice. How many times do you think we should toss them? Six? A number to make it easy to work out if each side has an equal chance?
Emma: I think six isn’t enough. Like Riley said, you might get a few of one in a row, so it has to have time to even out. Maybe a multiple of six, like 12 or 18, or maybe 30.
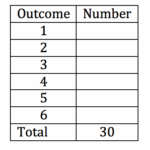
Teacher: On your paper, write down a table like this and label it, then fill in what you expect should be the outcomes of 30 tosses of a fair die.
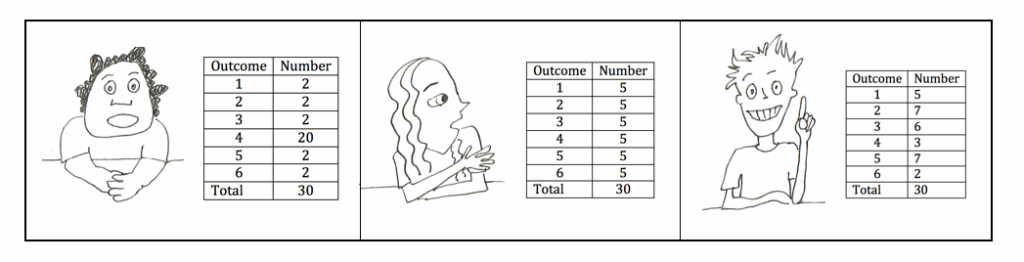
| Niko: This is because four is my favorite number, so it will come up most. Riley: But that would be a biased die. It couldn’t be fair, because the chance for four would be 2/3, not 1/6. | Sophie: I think it has to be even to be fair. Jack: But that’s too good. There would be random variation even with 30. | Jack: I think it would be more like this. There would be one far out and some near to five. |
Teacher: Comments? Were you careful not to toss in a biased way? Would you call the results random?
Emma: I don’t know. Look! I didn’t cheat and I got 11 sixes.
Sophie: Mine is the best because it is the most even.
Riley: Look, there aren’t many that came up exactly five times. That’s what surprises me.
Niko: My favorite number has let me down!
Emma: Maybe you should change your favorite number to three!
Teacher: Or, maybe we need to do some work on how to deal with the variation and expectation in chance events!
Think about the basic numeracy skills students need to compare the results for increasing numbers of trials: the basic conversion among fractions, decimals, and percentages. These skills can be reinforced when combining the seven data sets to compare the group’s 210 outcomes with individuals’ 30 outcomes.
Variation from Expectation
Displaying data in multiple forms often helps students see the messages in the data and identify trends. To help the students see the variation in the individual and group results, the teacher decides a visual representation might be useful.
Teacher: Let’s plot the data to get a better feeling for how much variation is in each one. Let’s use Emma and Sophie’s data.
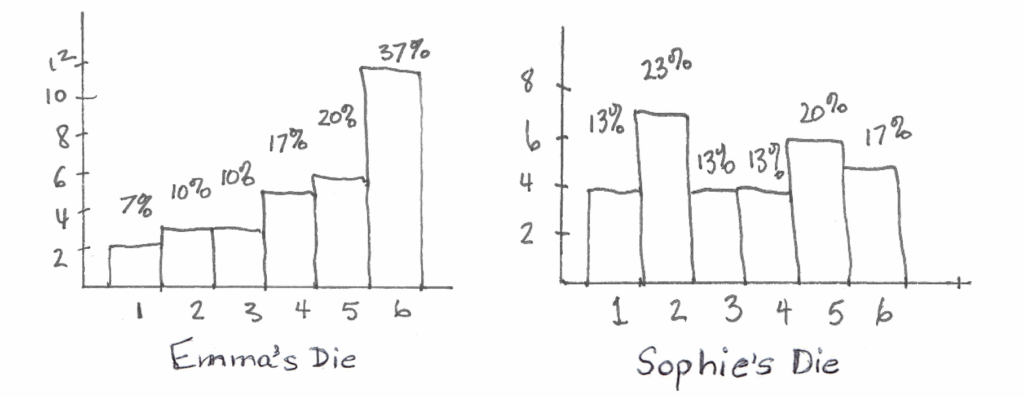
Sophie: Gee, the variation shows up like this, doesn’t it? Let’s plot the total of 210 tosses.
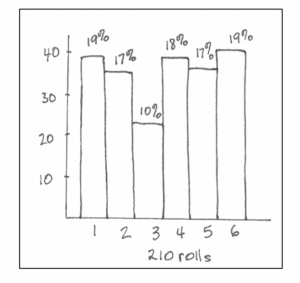
Sophie: The scale is different, but except for the 10%, the results look closer to 17% than when we did only 30 tosses each.
Niko: Would the percentages get closer to 17% if we did 600 tosses, instead of 210?
Teacher: Great question. How about I set up the sampler in TinkerPlots to generate 600 tosses of the die to find an answer? If we do 600 rolls, what do we expect from a fair random generator?
Mia: 100 on each side.

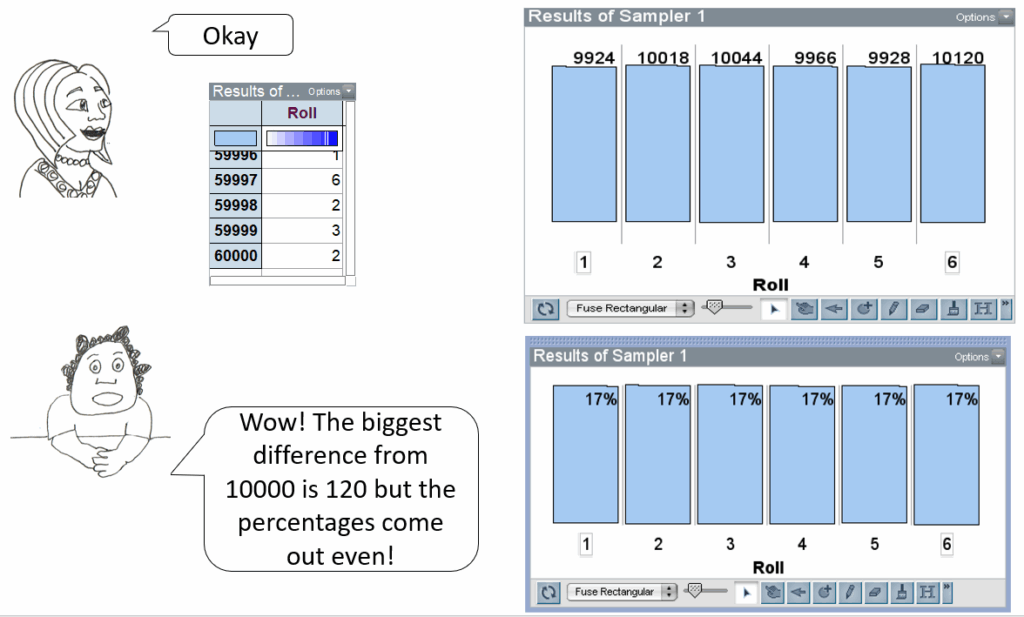
This result prompts a discussion comparing the frequencies with the percentages they represent of the total number of tosses. The progression in the number of trials continues in TinkerPlots to 6,000, with a difference of 1% in the outcomes. This prompts Niko to ask for 60,000 tosses, hoping for results even closer to the expected percentage.
Connecting the Big Ideas
Teacher: What have we learned from rolling dice about randomness, variation, and expectation?
Mia: If you roll a fair die long enough, the outcomes will match what we expect if we just say, “It has six sides and is fair!” The chance is 1/6 for each number.
Riley: But, along the way, there can be lots of variation from 1/6.
Niko: Because of all the random variation, it takes a long time—lots of trials—before we reach the expected values.
Teacher: Who can give us a general summary?
Emma: I learned an expectation has a variation, but there will always be a common expectation. A variation could be decreased when the number of rolls is increased.
Teacher: Yes, this seems to fit our die-tossing scenario, but maybe not a common expectation for footy scores.
Jack: I learned expectation and results have a variation. The more trials conducted, the less variation between results and expectation.
Teacher: And what do we call the whole process?
All: RANDOM!
Sophie: And it starts with variation and ends with the expectation!
It may be useful to end by thinking about a learning progression that might be expected over the middle-school years or displayed by the responses of students in a single class.
The learning progression presented in the dialogue appears to follow the levels of the SOLO Taxonomy (Table 1), put forth by John Biggs and Kevin Collis in their 1982 book Evaluating the Quality of Learning: The SOLO Taxonomy. It starts with acknowledging the intuitions and ideas students have when talking about data at the idiosyncratic level. Student learning then progresses through stages until students build the capacity to interpret data through analyzing complex graphical representations, applying proportional reasoning, and using sophisticated probabilistic language at the critical mathematical level.
Table 1: Levels of SOLO Taxonomy
| Level 1: Idiosyncratic | Beliefs and superstitions |
| Level 2: Informal | Physical observations and characteristics of devices |
| Level 3: Inconsistent | Observation of “more” and “less,” rather than frequency; suggest carrying out a few trials |
| Level 4: Consistent-Noncritical | Appreciation of variation in chance outcomes and fairness (equal likelihood) |
| Level 5: Critical | Prediction of reasonable variation in chance outcomes; basic likelihood numerical values (e.g., 1/6, 1/2) |
| Level 6: Critical Mathematical | Use of proportional reasoning (e.g., percentage) to estimate probabilities; interpret subtle aspects of language (e.g., random and variation) |
Conclusion
The concept of variation is noted in the curriculum in the early years of schooling. This provides the opportunity to start building students’ understanding of statistical concepts early in their education. The foundation laid at that time will grow and develop further as ideas about comparing observed and expected frequencies are covered. The focus in the middle years of schooling is likely to be extended to approximating probabilities by observing long-run relative frequencies. The classroom dialogue suggested in this article illustrates the opportunity to link three of the big ideas of statistics (variation, expectation, and randomness) in the early middle-school years and value-add to the curriculum. Over the years, students will have opportunities to reinforce their understanding in many other contexts. The goal is an appreciation for a random process, as stated by David Moore in “Uncertainty,” which appears in On the Shoulders of Giants: New Approaches to Numeracy:
Phenomena having uncertain individual outcomes but a regular pattern of outcomes in many repetitions are called random. ‘Random’ is not a synonym for ‘haphazard,’ but a description of a kind of order different from the deterministic one that is popularly associated with science and mathematics. Probability is the branch of mathematics that describes randomness.
Further Reading
Australian Curriculum, Assessment and Reporting Authority. 2018. Australian Curriculum: Mathematics. Sydney, NSW: Author.
Biggs, J.B., and K.F. Collis. 1982. Evaluating the quality of learning: The SOLO taxonomy. New York, NY: Academic Press.
Common Core State Standards Initiative. 2010. Common Core State Standards for Mathematics. Washington, DC: National Governors Association for Best Practices and the Council of Chief State School Officers.
Ministry of Education. 2013. The New Zealand Curriculum Online. Wellington: Author.
Ministry of Education. 2018. NZC: Glossary of Mathematics Terms. Wellington: Author.
Moore, D.S. 1990. Uncertainty. In L.A. Steen (Ed.), On the shoulders of giants: New approaches to numeracy (pp. 95–137). Washington, DC: National Academy Press.
Walshaw, M., and G. Anthony. 2008. The teacher’s role in classroom discourse: A review of recent research into mathematics classrooms. Review of Educational Research, 78(33), 516–551. DOI: 10.3102/0034654308320292
Watson, J.M. 2016. Dice: Fair or not fair? That is the question. In E.A. Silver and P.A. Kenney (Eds.), More lessons learned from research, Volume 2: Helping all students understand important mathematics (pp. 247–257). Reston, VA: National Council of Teachers of Mathematics.
Watson, J.M. 2017. Reasoning and sense making in statistics and probability. In M. Battista (Ed.), Reasoning and sense making in grades 6–8 (pp. 73–112). Reston, VA: National Council of Teachers of Mathematics.
Watson, J., & English, L. 2013. The power of percent. Australian Primary Mathematics Classroom, 18(4), 14–18.
Watson, J., & English, L. 2015. Expectation and variation with a virtual die. Australian Mathematics Teacher, 71(3), 3–9.
Watson, J.M., N. Fitzallen, and P. Carter. 2013. Top Drawer Teachers: Statistics. Melbourne: Education Services Australia.
Watson, J., N. Fitzallen, J. Fielding-Wells, and S. Madden. 2018. The practice of statistics. In D. Ben-Zvi, K. Makar, and J. Garfield (Eds.), International handbook of research in statistics education (pp. 105–137). Cham, Switzerland: Springer.