This investigation was originally published in Bridging the Gap Between Common Core State Standards and Teaching Statistics by Pat Hopfensperger, Tim Jacobbe, Deborah Lurie, and Jerry Moreno. (Grade 6 – Common Core State Standards: 6.SP.1-4) This investigation is based on one found in the Appendix for Level A in Guidelines for Assessment and Instruction in Statistics … [Read more...] about Lesson Plan: Who Has the Longest First Name?
6-8
Lesson Plan: Can You Roll Your Tongue?
This investigation was originally published in Bridging the Gap Between Common Core State Standards and Teaching Statistics by Pat Hopfensperger, Tim Jacobbe, Deborah Lurie, and Jerry Moreno. (Grade 6 & 8 – Common Core State Standards: 6.RP.3C, 6.SP.3, 8.SP.4) This investigation focuses on students examining an association between two categorical variables. Specifically, … [Read more...] about Lesson Plan: Can You Roll Your Tongue?
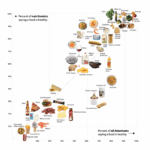
ASA and New York Times Partner to Create ‘What’s Going On in This Graph?’
By Sharon Hessney, Donna LaLonde, and Rebecca Nichols In this column, we want to highlight an exciting new partnership between The New York Times Learning Network and the American Statistical Association. Fifteen years ago, The New York Times started the Learning Network—a free, online feature that provides materials to help teachers use the newspaper … [Read more...] about ASA and New York Times Partner to Create ‘What’s Going On in This Graph?’
Lesson Plan: How Far Can You Jump?
This investigation was originally published in Bridging the Gap Between Common Core State Standards and Teaching Statistics created by Pat Hopfensperger, Tim Jacobbe, Deborah Lurie, and Jerry Moreno. (Grade 6 – Common Core State Standards: 6.SP.1-5) This investigation focuses on students conducting a comparative experiment to explore the effect a fixed target will have on … [Read more...] about Lesson Plan: How Far Can You Jump?
Lesson Plan: How Tall Were the Ancestors of Laetoli?
This investigation was originally published in Bridging the Gap Between Common Core State Standards and Teaching Statistics by Pat Hopfensperger, Tim Jacobbe, Deborah Lurie, and Jerry Moreno. (Grade 8 – Common Core State Standard 8.SP.1) The focus of this investigation is to look for and measure the degree of any relationship between two quantitative variables, specifically … [Read more...] about Lesson Plan: How Tall Were the Ancestors of Laetoli?
Lesson Plan: How Fast Are You?
By Maryann Huey, Alana Linde, Dan Aalbers (Grades 6-8, 9-12+) In this lesson, published in August 2017, each student collects 20 reaction-time data values using an online tool for testing reaction times to a visual stimulus. Students display and analyze data via a free online tool, Tuva. Students first characterize their own reaction times, and then compare the results … [Read more...] about Lesson Plan: How Fast Are You?
Lesson Plan: Are Female Hurricanes Deadlier Than Male Hurricanes?
By Mary Richardson (Grades 6-8, 9-12+) Originally published in June of 2014, this lesson uses a data set partially discussed in the article "Female Hurricanes Are Deadlier Than Male Hurricanes," written by Kiju Junga, Sharon Shavitta, Madhu Viswanathana, and Joseph M. Hilbed. The data set contains archival data on actual fatalities caused by hurricanes in the United States … [Read more...] about Lesson Plan: Are Female Hurricanes Deadlier Than Male Hurricanes?
Lesson Plan: First Day Statistics Activity—Grouping Qualitative Data
By R.B. Campbell (Grades 6-8, 9-12+) This activity, published in April of 2014, provides a foundation for distinguishing between qualitative (categorical) and quantitative data and how they can be summarized and analyzed (a topic encountered early in a statistics course). This lesson illustrates how categorical data can be grouped to make the data comprehensible. It also … [Read more...] about Lesson Plan: First Day Statistics Activity—Grouping Qualitative Data
Developing Authentic Assessments
Developing authentic formative and summative assessments is challenging, so this column will focus on suggestions for lesson-specific assessments to overarching frameworks. The Guidelines for Assessment and Instruction in Statistics Education (GAISE) Report: A Pre-K–12 Curriculum Framework, published in 2007, remains an important resource for developing authentic … [Read more...] about Developing Authentic Assessments
Technology Insights
By Rebecca Nichols and Donna LaLonde One of the Standards for Mathematical Practice calls on students to “Use appropriate tools strategically.” In part, this practice viewed through a statistical lens is described in the Statistical Education of Teachers (SET) report as, “Statistically proficient students at various grade levels are able to use technological tools to carry … [Read more...] about Technology Insights


