• Skip to main content
  • Skip to secondary menu
  • Skip to primary sidebar
  • Skip to footer
  • Home
  • About Statistics Teacher
Statistics Teacher

Statistics Teacher

Supporting the Teaching and Learning of Statistics

  • Submissions
  • Articles
    • 9-12+
    • 6-8
    • K-5
  • Announcements
  • Lesson Plans
    • Lesson Plans
    • Lesson Plan Archive
  • Resources
    • Free Webinars
    • Posters
    • Publications
    • Supplemental
  • Events
You are here: Home / Announcements / Improve Quantitative Literacy with Graphs

Improve Quantitative Literacy with Graphs

March 15, 2018

Live Discussion Now Weekly on Wednesdays

Build quantitative literacy with your middle- and high-school math, science, and humanities students with the free weekly online feature “What’s Going On in This Graph?”

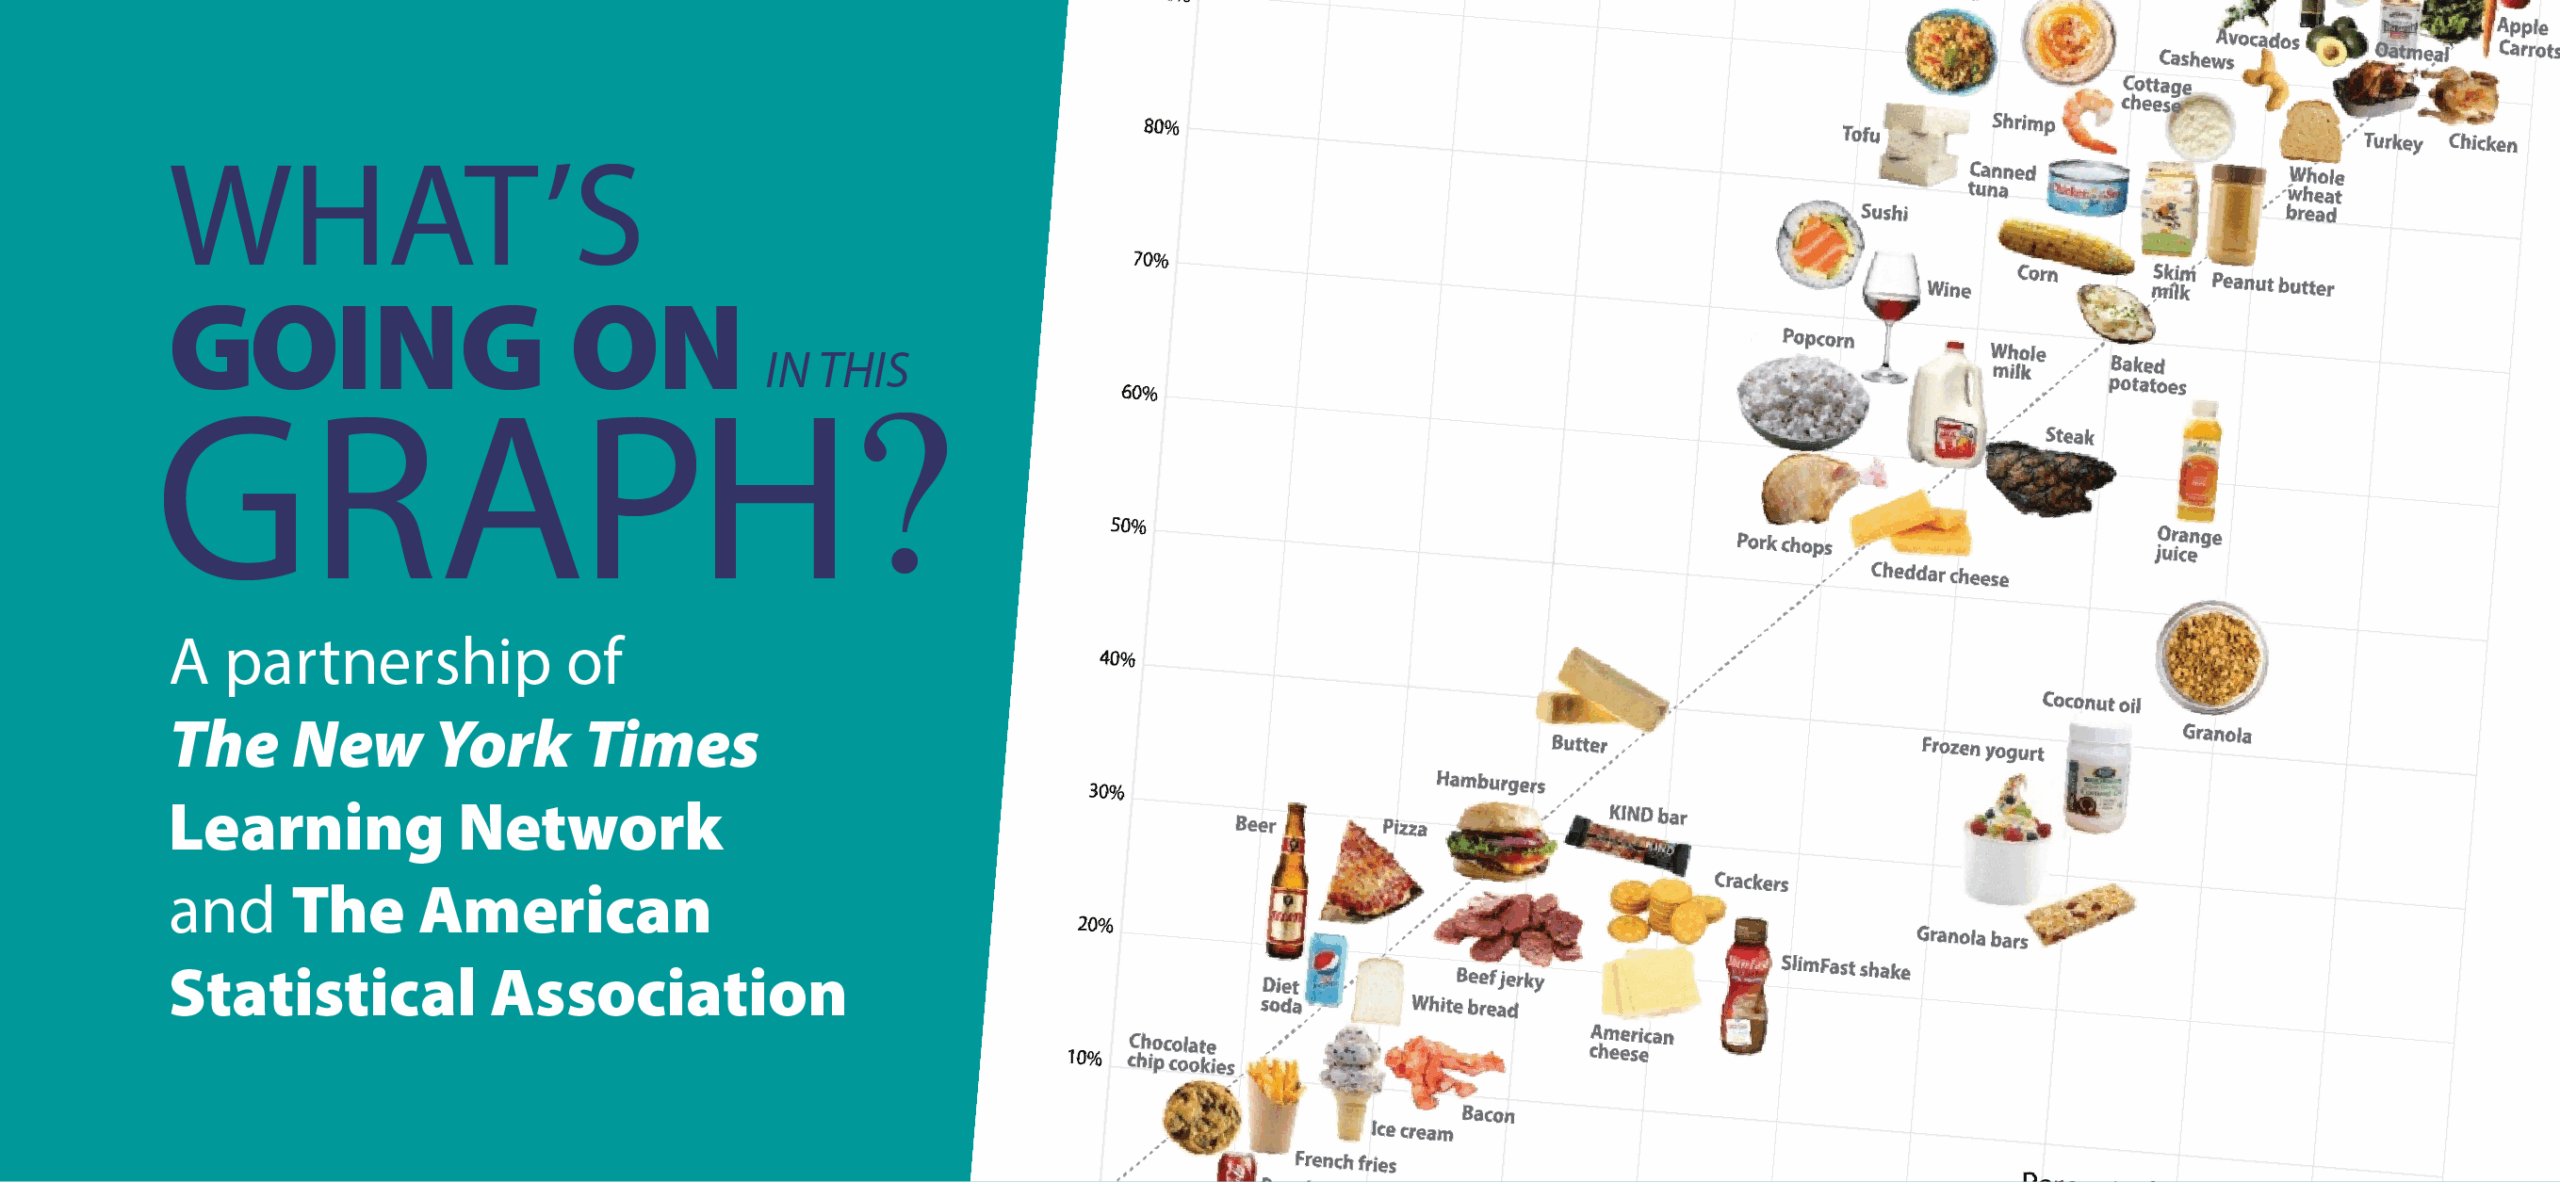
Starting on September 12, The New York Times Learning Network—in partnership with the American Statistical Association—will host a live discussion most Wednesdays throughout the school year about a timely graph. The graphs will be of different types and context, and we will ask students the following questions:

  • What do you notice?
  • What do you wonder?
  • What’s going on in this graph?

Students from around the world can “read” the graph by posting comments about what they notice and wonder about in an online forum. Our staff live-moderates by responding to the comments in real time and encouraging students to go deeper. All releases are archived, so teachers can use previous graphs anytime.

Visit this introductory post and this article about how teachers use this powerful activity.

Primary Sidebar

EDITORS’ NOTE

Student Competitions

  • ASA Data Visualization Poster Competition
  • Virtual Science Fair
  • ASA Statistics Project Competition

Categories

Archives

Archives (1982-2016)

Footer

About

Statistics Teacher (ST) is an online journal published by the American Statistical Association (ASA) – National Council of Teachers of Mathematics (NCTM) Joint Committee on Curriculum in Statistics and Probability for Grades K-12. ST supports the teaching and learning of statistics through education articles, lesson plans, announcements, professional development opportunities, technology, assessment, and classroom resources. Authors should use this form to submit articles or lesson plans.

Contact

Contact the Statistics Teacher editors for further information or to volunteer to write or review content.

Copyright © 2026 · American Statistical Association